Assignment 9: Third Interactive Prototype
User Interface Design
- Assignment 1: Project Proposal
- Assignment 2: Project Personas, Goals, and Task Analysis
- Assignment 2 Appendix A: Interviews
- Assignment 3: Project Scenarios, Comparative Analysis, and Preliminary …
- Assignment 4: Low-fi Prototying & Usability Testing
- Assignment 5: First Interactive Prototype
- Assignment 6: Heuristic Evaluation of …
- Assignment 6: Play it by Ear's Heuristic Evaluation of iNaturalist
- Assignment 7: Second Interactive Prototype
- Assignment 8: Pilot Usability Study
- Assignment 9: Third Interactive Prototype
System Architecture / Document Engineering
I213 User Interface Design and Development
Prof. Marti Hearst
Nate Agrin
Jessica Kline
Andrew McDiarmid
Ken-ichi Ueda
Contents
- Problem Statement
- Solution Overview
- Personas and Scenarios
- Final Interface Design
- Design Evolution
- Work Contribution
- Appendices
Problem Statement
iNaturalist.org is a proposed online community for people interested in the natural world. It serves three purposes: providing software tools for recording information about nature, sharing authoritative or user submitted natural history information, and facilitating communication between naturalists. For this project, we chose to develop the interface for submitting observations of living things. This involved three kinds of data: the identity of the organism, the time of the observation, and the location of the observation. Our challenge was to design a system that was both familiar and engaging enough to let users enter their data easily, without distraction or annoyance.
Solution Overview
Our final prototype focuses on location by establishing map annotation as the primary mode of data entry, providing an engaging experience that meets the needs of our personas. This contrasts with our earlier designs which were more oriented toward lists. Users click on the map locations where they made their observations, and fill in their data in a callout from the resulting map marker. Saved observations remain on the map, as well as in a reference list on the right side of the window. Our final design is stylistically minimalist, using color only to attract or guide attention. Whenever possible, it indicates what actions can be taken (such as tool tips and rollover effects in the side bar) and provides feedback resulting from the user's actions (such as the red flash in the side bar upon deleting an observation). The third interactive prototype is available here.
Personas and Scenarios
Primary Personas
Jenny Takahashi

Goals
- Eat well
- Gain a greater understanding of mushrooms, especially edibles
- Remain social with established friends
Justification
Jenny was created after we decided that Mike Yee and Lauren Polansky represented edge-case mushroom hunters (see Rejected Personas below). The mushroom foragers we interviewed had respect and appreciation for nature as well as an interest in cooking and eating edible mushrooms. Therefore, Jenny represents a typical mushroom user. She also represents the many mushroom hunters that have privacy concerns; while she would like to share observations with her friends, she is opposed to granting such access to the general public. Furthermore, Jenny is an ideal user for this system because she consistently documents her findings.Adam Thompson
Goals
- Be prepared with local nature knowledge for his trips
- Teach others about nature
- Expand his knowledge of nature for his own edification
- Meet like-minded people
Justification
Adam is our casual, general user. Not everyone will have the inclination to record data consistently, but we think many users may find the data that others record quite useful, and will also be interested in the social aspects of data sharing. Adam, therefore, has an incidental, largely utilitarian approach to the service, insofar as it helps him with his job and with his social life. He is also not a specialist, like a birder or a mushroom gatherer. He is interested in a more holistic view of what can be observed in an area, which is another potential use we envision for this service.Edge Case
Ted Sinclair

Goals
- See every bird in the world
- Be well-respected in his local birding community
- Get outside
Justification
One of our interview volunteers described especially avid and popular birders in the community as "hot birders." They are the most passionate, knowledgeable, and/or skillful birders in the area, and are often community leaders who lead trips and act as authorities on identification. Judging from our interviews, it seems these people are the most likely to keep rigorous notes on their birding observations, so we think they have a high probability of using iNaturalist. Ted, therefore, is our "hot birder," technically an amateur but still extremely skilled and knowledgeable about birds and birding.Another interesting component of this group that came out of our interviews was the consideration of reputation. Birders compete in general over who can spot rare birds first, or who can take the best photograph. They also specifically compete in events called "Big Days" or "Big Years" in which they choose a location and try to beat the record of how many species have been observed in that area in the past. Ted embodies this aspect of the community by valuing his position as an expert. We do not see him as egotistical, but rather as unconsciously proud.
Rejected Personas
Frances del Toro
Frances is a retired school teacher who enjoys birding a few times a week while she goes for walks on the beach. Ever since her husband died, she's found that birding helps her stay active and social. She enjoys birding with a group of friends or with her local Audubon Society a few times a month. She has a big family, and is always amazed by how much her grandchildren use computers. She is just starting to use e-mail herself, but feels she has a lot to learn.Goals
- Stay social
- Stay physically and mentally active
- Teach her grandchildren about birds
- Know her natural environment
Justification
We originally developed Frances to represent the many retired birders. She also represented a non-expert, both in the realm of birding and of computer use, so we thought she might be a useful edge case. After our task analysis, however, it became apparent that none of the tasks we had found important for most of our personas were very important to her, so we decided not to consider her in further development. We still think she represents a set of real potential users, though, so she may yet play a role if we decide to broaden our target audience.Mike Yee
Mike is 19 and a computer science major. He feels a lot of pressure from his family to succeed; he lives in the footsteps of two older siblings: one is a recent business school graduate and the other will attend medical school in the fall. As a freshman Mike took a mycology class (to fulfill a general education requirement) and loved his experience. He is especially interested in learning more about the complex spores that mushrooms reproduce. Mike is quiet, neat and organized, and lives in the dorms.Goals
- Learn more about mushrooms
- Distinguish himself from his siblings
- Be successful (in school and in life)
Justification
We originally developed Mike to represent the heavily technical user that is enthusiastic about utilizing our system. However, Mike is not interested in many of the tasks important to many mushroom foragers, such as hiking, eating and cooking mushrooms, identifying mushroom specimens, as well as distinguishing between edibles and non edibles. Because Mike does not represent a typical mushroom gatherer, we decided to no longer consider him for future development.Lauren Polansky
Lauren is a line cook at a semi-fancy restaurant. She's in her early thirties and working her way through culinary school. She has some tattoos and some debt. Lauren and her dog, Tank, enjoy exploring urban parks and private property. She enjoys the money she saves by finding edible mushrooms and keeps a mental record of her discoveries. Recently, she found a patch of Chanterelles in a spot that she hopes to keep hidden. Lauren uses a second generation iBook and has a MySpace account, but doesn't enjoy spending time on her computer.Goals
- Finish culinary school
- Walk the dog and explore new areas
- Find edible and psychedelic mushrooms
Justification
We originally developed Lauren to represent a mushroom hunter that is not interested in sharing her discoveries, but more than willing to utilize the data shared by others. However, Lauren is not an ideal user of our system because she is unwilling to share information with anyone (including friends) and she only keeps a mental record of her discoveries. While it is important that we are aware of mushroom users such as Lauren, she is a non-contributing member of our system so we decided to no longer consider her for initial development.Scenarios
Our original narrative scenarios appear below, followed by the tasks we tested in our pilot usability study. The originals proved too ambitious for our timeline, and over the course of the semester we gradually pared down the scope to focus on the observation adding interface, leaving out browsing existing observations, friend management, and incorporation of outside data. The bold portions of the narrative scenarios are relevant to the current prototype. Other tasks described remain as goals for future work.
Narrative Scenarios
A Typical Weekend for Jenny
It has been a typical weekend for Jenny. On Saturday she attended an early morning pilates class and the farmers' market, spent the afternoon with a cappuccino and a good book, and in the evening grabbed tapas and drinks with a friend.
On Sunday Jenny wakes up before sunrise to get ready for her weekly hike with her mycological society friends. She packs her backpack with a nice snack (a peppered turkey sandwich on a baguette with roasted peppers, arugula, and an aioli sauce), a notebook, a field guide, a camera, and a brown paper bag (in case they find edibles). Jenny and her friends go to one of their usual spots in Marin County. The group acknowledges the recent rain as they spotted many mushroom varieties, including porcinis! Other notable findings include chanterelles as well as brightly colored Amanitas and waxy caps. Jenny takes a few photos and notes of each discovery, including the species name, a description of the landscape, and the surrounding flora. The group also spots an unknown Amanita. After referring to their respective field guides, Jenny and her friends are unable to determine the exact species and decide to identify it at home.
Later that evening (after a relaxing afternoon of NPR and mushroom risotto) Jenny logs onto iNaturalist. She creates a new trip, transfers her earlier notes, and adds a few photos. She also specifies the friends that will be allowed to access her trip information. Jenny then searches for Amanitas and is still unable to identify the unknown mushroom. A little perplexed, she adds the observation to the Bay Area mushroom identification group and hopes for a speedy ID.
Ted Gets New Scope
Ted gets a new scope and just has to go birding. He gets up at 5 AM, puts on his lucky duck-pattern boxers, carefully packs his digital SLR, his camera mount for the scope, his general field guide to western birds and his Northern California shorebird guides for those tricky cases, and his trusty notebook. He jumps in the car and heads for his favorite marsh, where he knows there are plenty of shorebirds and ducks that are perfect for scoping (plus a few raptors). At his first spot on a hill overlooking an inlet, he sees a few old friends: a few Ruddy Ducks, some Buffleheads, a grebe or two, and dear lord, what is that?! Ted spots a bird he wasn't expecting at all: a Harlequin Duck! Spectacular! He's seen them on a few trips to the San Juan Islands near Seattle, but never in the Bay Area! Immediately, Ted dives into his bag and grabs the camera and the mount. He fumbles a bit, but finally gets the camera attached and, thank God, the duck is still there. He snaps a ton of pictures, many in just the right light. After he has calmed down a bit, he gets out his notebook and writes down the time and the location, making sure to use many exclamation points. The rest of the trip is fairly status quo, but bathed in the golden aura of that one, key sighting.
When he gets home, his wife is up but bleary-eyed, and has a pot of coffee on. Ted glows with excitement, describing the Harlequin rapidly, as his wife smiles and nods. He grabs a cup of coffee and his ThinkPad and sits down at the kitchen table. He logs onto iNaturalist and creates a new outing. First he adds information about the Harlequin (photos, time, location, species, special characteristics) and imports other information such as weather patterns and temperature. After he's completed his entry about this very special duck he adds some information about the rest of the day's sightings. He also checks the recent entries of other avid birders in the area. He realizes he's the first to post the Harlequin! He announces this great discovery to his local Audubon group on iNaturalist. Go Ted!
Ted Browses and Answers Questions
Ted has been thinking about the Harlequin Duck he sighted all day: while shopping for groceries, while doing a little work from home, even at the gym. Spared the dishes for having cooked dinner for once, Ted sits down with his laptop again and logs back into iNaturalist to see if there has been any discussion over his sighting. He is happy to find that there has been ample chatter in his local Audubon group over the bird, with many people complimenting him on his fine photographs, and others reporting sightings of the same bird later in the day. Nick, one of his frequent birding buddies and fellow Audubon trip leader, was one of the participants in the discussion, and had actually taken some photos of the duck himself. Ted goes to Nick's home page on iNaturalist to check them out, and leaves Nick some complimentary comments. Nick also saw some Clapper Rails that morning, and Ted registers a fleeting tinge of frustration at having missed them. Seeing Nick's observations reminds Ted to check and see what his other friends have seen on iNaturalist. Angela was in a different park, and in addition to the normal array of wintering ducks and waders, she spotted a few migratory warblers. That's a bit early, thinks Ted, and checks when those species were first sighted passing through this area last year.
Ted also checks the Bay Area bird identification group. He tries to help identify a sandpiper someone photographed. He thinks it's probably a Western Sandpiper, but they look very similar to Least Sandpipers, so he asks for a few more details on coloration, or some extra photos. He also helps ID some easy ones, like an American Coot and a White-tailed Kite.
Adam Goes to Idaho
Adam is leading a trip to Hell's Canyon in Idaho in a few weeks, and wants to brush up to impress the travelers with his knowledge of local flora and fauna. He remembers that his friend Shauna spent a weekend in the same park last year, and he knows he can rely on her reconnaissance. After his morning run, he puts on his favorite Phish record, logs into iNaturalist, and browses through his friends list to find Shauna's profile. He searches her entries for Hell's Canyon National Recreation Area, and finds the trip he remembers. Shauna's not the best at describing exactly what she sees, but Adam is able to see enough pictures, species names, and the occasional fun fact to get him started. He makes a few notes for things to look up in his field guides.
From the page for Shauna's trip, Adam clicks a link to more entries for this location and hits the jackpot -- dozens and dozens of entries. He reads up on interesting local vegetation and wildlife, noting by repeat appearances what he's likely to encounter. He also jots down notes on a few bizarre and beautiful things to look out for. Excited about his initial research, Adam alternately leafs through a few field guides and Googles some of the things he's seen to learn a bit more.
Pilot Usability Test Tasks
1. You recently went to Tilden Park and spotted a Monarch Butterfly. Please use iNaturalist to add the species name to any location in Tilden Park.
2. You recently made trips to Point Reyes and Half Moon Bay. Please record your trip observations onto iNaturalist:
- You went to Point Reyes the morning of Sunday April 22, 2007, and observed a Chantarelle mushroom and a Turkey Vulture. Please add the species name, date/time, and photo to any location in Point Reyes. Also please include the following description to the Chantarelle mushroom observation: "mushrooms are yummy."
- You went to Half Moon Bay the afternoon of Saturday April 28, 2007. And you observed an Olive's Aeolid (a type of sea slug) and an Anna's Hummingbird. Please add the species name, date/time, and photo to any location in Half Moon Bay. Also please include the following description to the Olives Aeolid observation: "sea slugs are very pretty."
3. You recently added a group of 10 observations and have realized that you need to make some edits. Please edit the following two observations:
- You originally reported finding a Pocket Gopher in Cesar Chavez State Park. However, you realized that you spotted it at the Albany Bulb. Please edit the observation's location.
- You originally reported a mushroom in Tilden park and named it "Mario Brothers Mushroom". However, after talking to a mushroom-expert friend you've learned that this mushroom is called an "Amanita muscaria". Please edit the species name.
Final Interface Design
Prototype Functionality
Our interface initially presents the user with a large map from Google Maps (including most of the standard Google Maps tools such as zoom and pan buttons and different map types), a floating instruction window, a "Help" link, a location search tool, and an empty list of observations. The floating help window can be dismissed by clicking anywhere on the map, and will only be shown to new or infrequent users, as per Prof. Hearst's suggestion. Clicking the "Help" link brings this floating help window back if users need it for reference. The location search tool simply finds any place that Google Maps can geocode, and zooms the map to that location. If it cannot find the place, it issues an apology in a pop-up window.
Clicking on the map adds a marker and pops up a callout for a new observation. This callout contains form fields for a species name, general time of day, date, and a description. Users can set the date by entering text or using a graphical calendar widget. They can add a photo to the observation by clicking on the box labeled "Click to Add a Photo," which pops up a lightbox (a box that appears on a darkened, partially opaque overlay over the main window) that allows users to select a photo from the local machine and upload it. All form fields in the callout have gray tips and suggested content in them to help users know what kind of content to add. All text fields also change their background color when clicked to further indicate that users can edit them.
When users complete an observation by clicking "Done," the callout closes, the marker receives an identifying letter, and a summary of the observation appears on the observation list to the right. Users can edit the observation again by clicking on the marker on the map or in the observation list. Hovering over the marker in either location highlights both representations with a different color. Users can drag a markers around the map to change the observation's location.
Interaction Flow
Features Not Implemented
Unfortunately, not everything could be accommodated in our interface within the limited amount of time available during the semester. The functionality described below was either scoped out of our final interface, or could not be encoded using the technologies we chose. Future designs will likely consider these as important and implement them either in a variation of our final interface or in new interfaces which meet the needs of advanced users.
- One major issue is the grouping of markers on the map, when many observations are placed close to each other. We never tested our participants for issues surrounding difficulties which may arise from tightly grouped markers, and thus never implemented a grouping algorithm. In the future we plan on grouping markers based on zoom level, and providing a ‘collective’ marker which, when clicked on, will open a window that shows a summary of markers contained within the collection.
- Photo uploading proved to be a major technological implementation hurdle we had to overcome. Because of that, we were not able to implement our original plan, to allow multiple photos to be attached to each observation. In order to accomplish this, we may need to redesign our observation form, as well as the list of observations on the right of the screen. The problems we encountered with implementing photo uploading also prevented us from creating a function whereby users could change photos they have already attached to observations.
- In our original proposal we placed a strong emphasis on time selection so that users could clearly and explicitly define when their observations occurred. These might have taken place over a range of time, or at a specific moment. We pared this down to ‘Morning’, ‘Afternoon’, ‘Evening’ and ‘Night’ which provide loose ranges of time. Implementing our more advanced time selection interface was scoped out of this design. Implementation of it may imply changes in our current interface or may suggest a second add observation interface for advanced users.
- We ambitiously set off to provide a “one-size fits all” interface when we started, initially hoping to accommodate users who might use batch add methods and additional data as well as those users who would want simple, one-at-a-time interaction. Ultimately we found that both could not be accomplished through a single interface. To this end, we expect to create a more form-like interface which provides for speed of entry, over our more fun and visual map interface.
- Lastly, future features include browsing and searching of existing observations, as well as profiles, friend management, and commenting—all features which were included or alluded to in our initial scenarios, but ultimately proved beyond the scope of a one-semester course.
Development Tools
In prototyping our interfaces, we used regular paper prototypes and creative arts and crafts to simulate our potential final interface. When we intended to create an actual working interface, however, we turned to the classic web based architecture stack, HTML, CSS and Javascript, in order to create a visual mock-up with stylistic and behavioral traits. Behind the scenes, HTML was generated by the Ruby on Rails web framework, which provide a simple method for creating web applications quickly. In order to allow multiple members of the team to work on the code at one time we used Subversion (SVN), a versioning repository. Our SVN implementation was wrapped by a python-based package called Trac which provided our project wiki, as well as a method for our team to track bugs and feature requests throughout or development process. Finally to coordinate our notes and other document-based artifacts we often used Google’s suite of collaborative document tools.
HTML, CSS and Javascript, for better or worse, are defined standards and as such were fairly simple to work with. Ruby on Rails required formidable programming experience to understand, but afforded us an incredibly easy platform to build off of. Rails excels at disparate development of web services by including its own web server for local testing of code, and easily local configuration which does not affect other developer’s specific settings. SVN proved to likely be the most important component of our workflow, by allowing each of us to work concurrently on the same files without concern of overwriting each others changes. Trac was useful in that it provided a consolidated set of project management tools and allowed us to keep updated with each other’s development progress, although it was somewhat clunky and its user interface (ironically) could have better exposed the functionality within the package.
Our biggest issues in carrying out the project turned out to be in our use of Google documents and the wiki. Each served their own functions appropriately, however there was no simple way for us to convert from one format to another, a task we spent a good deal of time doing. Google docs is also very buggy when multiple collaborators are working on a single document. At these expenses, however, came the benefit of almost never having to exchange documents via email. The wiki also provided afforded us a ready made publishing platform and prevented us from having to develop a parallel website to host our development progress throughout or project.
Overall our tools were an excellent fit to our project’s needs and allowed us to work asynchronously, and ultimately, successfully.
Design Evolution
UI Progression
Our initial sketches consisted of a data-entry focused interface (which we frequently referred to as an any-order interface). This interface contained three static observation components, representing the what, when, and where of an observation: a description component (the what), a date and time component (the when), and a location component (the where). In our paper prototype we recreated the any-order interface and also designed an alternative interface, the map-first interface. This interface consisted of a static location component and provided description and date and time components once a location had been chosen. From the results from our lo-fi prototype tests, we found that our primary users preferred their experience using the map-first interface. Based on these findings, we recreated the map-first interface in our first interactive prototype, based on these PowerPoint storyboards. However, we were not completely satisfied with its interaction or layout and began designing a second version of this prototype. In this version we simplified the editing functionality and increased the size of the map. The heuristic evaluation found the interface fairly intuitive to use, but recommended we move the interface instructions to a more prominent location, add labels to data fields, and adjust the callout control buttons. In the second interactive prototype we implemented their recommendations and tested the interface in the final usability test. This study determined the need to move the interface instructions to an even more prominent location (in the second interactive prototype the instructions were moved to the map toolbar on the bottom of the map), provide feedback when the user clicks on a text field, and emphasize the primary control button. (The following images refer to the interfaces referred to in the above section).
Initial Sketches
Initial sketch: Any-order interface
Paper Prototypes
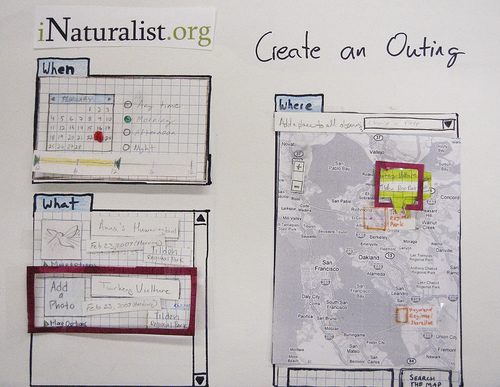
Paper prototype: Any-order interface
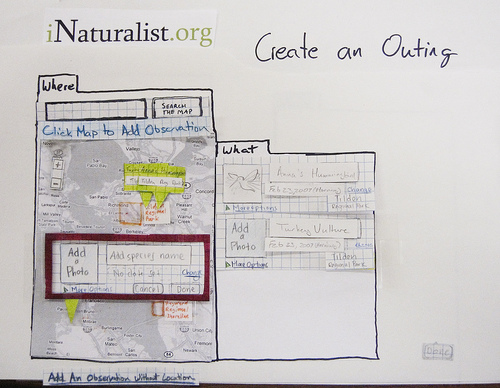
Paper prototype: Map-first interface
First Interactive Prototype
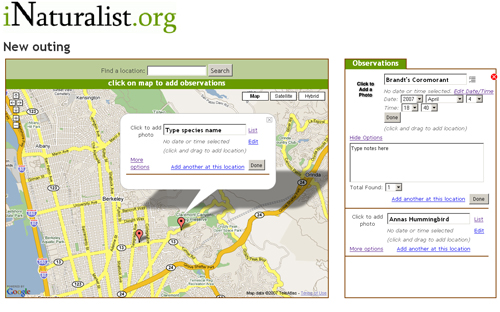
First interactive prototype: Map-first interface with batch-adding features and multiple edit locations
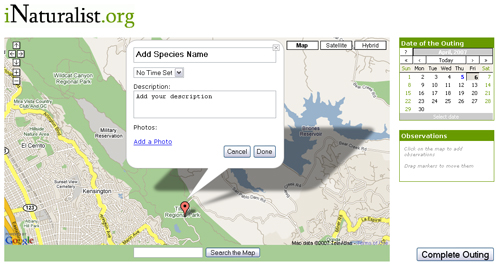
First interactive prototype: Simplified map-first interface
Second Interactive Prototype
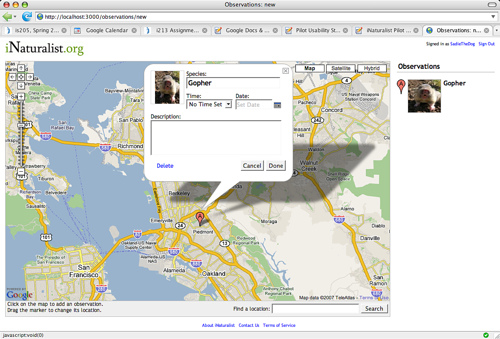
Second interactive prototype: Simplified map-first interface without outing references
Third Interactive Prototype
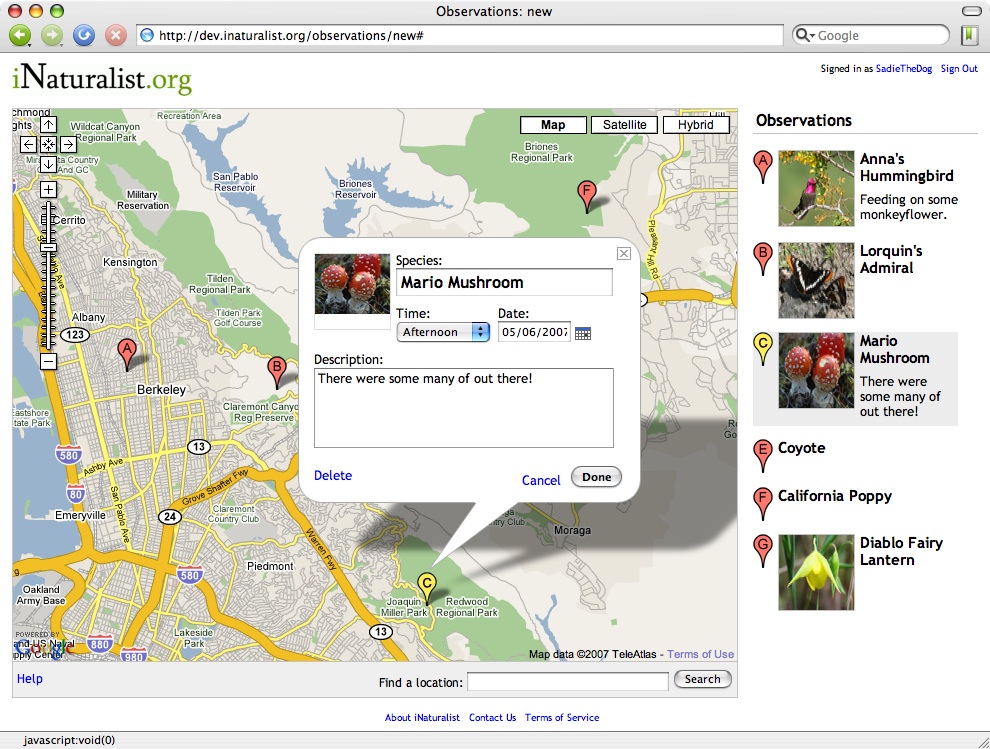
Third interactive prototype: De-emphasized Cancel and Delete buttons to links, marker highlighting on map and side bar
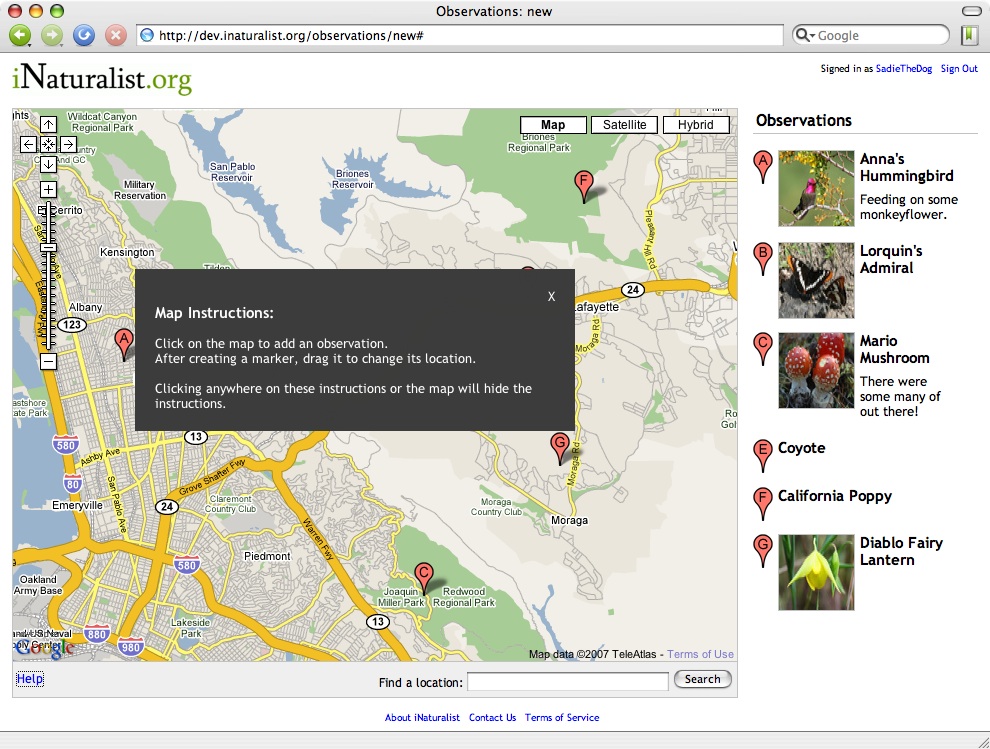
Third interactive prototype: Floating instruction window
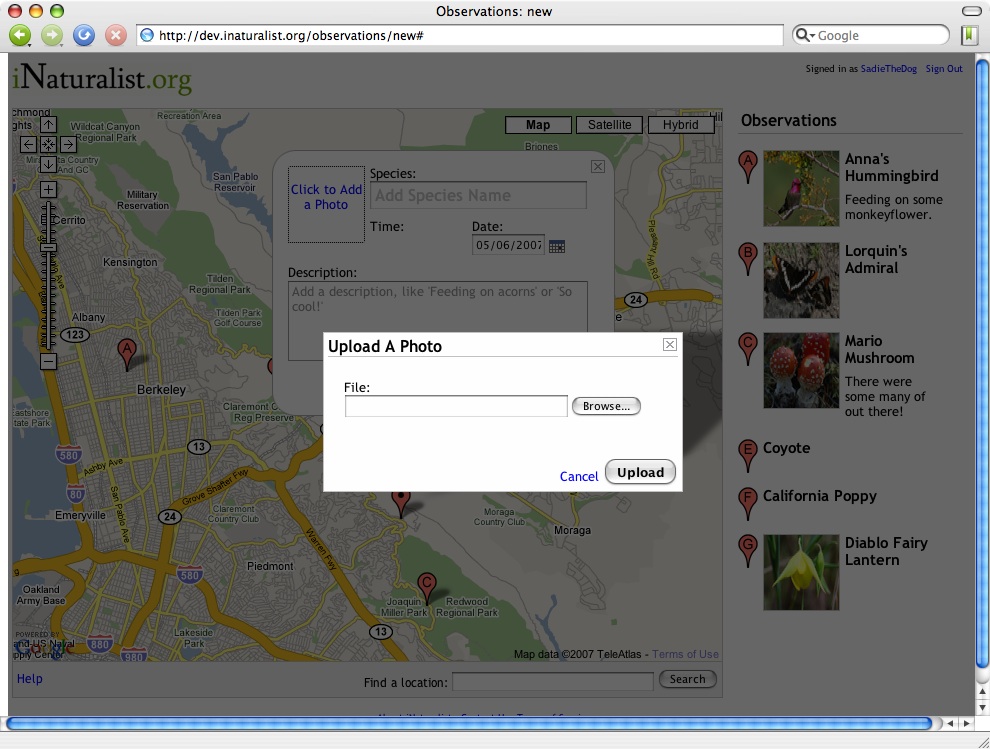
Third interactive prototype: Photo upload lightbox
Major Changes
During the course of our interface development we have made three significant design changes:
1. Adoption of the map-first interface: In our initial design sketches and paper prototype we designed an interface that provided users with the opportunity to add components of their observation in any-order (the any-order interface). We also designed an alternative paper prototype that provided users with an interface that required users to add components of their observation by first clicking on a map (the map-first interface). As a result of our lo-fi prototype tests we discovered that our primary users preferred the guided interaction and aesthetics of the map-first interface; we decided to develop this interface in future design iterations. (This design change is described in greater detail in the Evaluation Analysis section of the write-up).
2. Provide edit functionality in one location: In our paper prototype and version one of the first interactive prototype we provided two locations for users to edit previously created observations. Users could edit their locations in the map callout and in the observation list located on the side of the map. In version two of the first interactive prototype we limited the editing functionality to one location (in the mapcallout) but provided users with the ability to access this callout in multiple ways, by either clicking on the observation in the observation list or clicking on its respective the map marker. We made this change in order to expand the map and simplify the interface by limiting duplicate observation information.
3. Removed reference to the term "outing": While the use of the term "outing" was discussed in multiple iterations of our interface design (the initial design sketches, the paper prototype, and the first interactive prototype) we decided to remove use of this term in the second interactive prototype. This term refers to a group of observations seen by a naturalist, it can consist of multiple observations in one location or can span multiple locations. Although the term "outing" is frequently used by avid naturalists, it is less common for casual naturalists. And because our interface has shifted focus to casual naturalist, we decided to remove it from our interface because it has the potential to confuse our users.
Evaluation Analysis
While the heuristic evaluation and the pilot usability study each provided helpful feedback regarding word-choice and the location of instructions, labels, and control buttons, the lo-fi test provided the most valuable evaluation. This is because it informed us of the conflicting needs and wants of our two user types. We learned that our "power naturalist" users require batch-adding capabilities and support for precise location information. We also learned that our "casual naturalist" users find data entry forms intimidating and enjoy exploring the observations of others, interacting with maps, and browsing photos. Although we were aware of the different data collection habits of these two groups of users, we were unaware of their different interface preferences. Specifically, in our test of two interfaces (an "any-order" interface that allows users users to add observation components in any order as well as a "map-first" interface that requires users to add observations by first clicking on a map) we found that the "power naturalist" user preferred the "any-order" interface and the "casual naturalist" users preferred the "map-first" interface. In response to these results we decided to promote our corresponding "casual naturalist" personas as our primary personas and develop the "map-first" interface in future design iterations.
Work Contribution
| Task | Andrew | Jess | Ken-ichi | Nate |
| Design decisions and planning | 25% | 25% | 25% | 25% |
| Technical changes to interface | 10% | 0% | 40% | 50% |
| Write-up | 20% | 40% | 20% | 20% |
Appendices
Third Interactive Prototype
Final Presentation
This presentation provided an overview of our design process, presented heuristic evaluation results, compared the first and second interactive prototypes, presented pilot usability study results, and summarized future development and lessons learned. (See presentation slides)
Attachments
- a9-3rd_prototype-flowchart.jpg (96.2 kB) -
Interaction flow chart
, added by kueda on 05/09/07 15:08:23. - i213-a9-calendar.jpg (66.9 kB) -
Calendar widget
, added by kueda on 05/09/07 19:24:49. - i213-a9-main_screen.jpg (272.0 kB) -
Main screen of the 3rd interactive prototype
, added by kueda on 05/09/07 19:25:16. - i213-a9-upload_photo.jpg (197.4 kB) -
Photo upload lightbox
, added by kueda on 05/09/07 19:27:04. - i213-a9-instructions.jpg (263.8 kB) -
Floating map instructions
, added by kueda on 05/09/07 19:33:26.

