Assignment 5: First Interactive Prototype
User Interface Design
- Assignment 1: Project Proposal
- Assignment 2: Project Personas, Goals, and Task Analysis
- Assignment 2 Appendix A: Interviews
- Assignment 3: Project Scenarios, Comparative Analysis, and Preliminary …
- Assignment 4: Low-fi Prototying & Usability Testing
- Assignment 5: First Interactive Prototype
- Assignment 6: Heuristic Evaluation of …
- Assignment 6: Play it by Ear's Heuristic Evaluation of iNaturalist
- Assignment 7: Second Interactive Prototype
- Assignment 8: Pilot Usability Study
- Assignment 9: Third Interactive Prototype
System Architecture / Document Engineering
I213 User Interface Design and Development
Prof. Marti Hearst
Nate Agrin
Jessica Kline
Andrew McDiarmid
Ken-ichi Ueda
Contents
- Introduction
- Revised Interface Design
- Prototype Overview
- Work Contribution
- Instructions for Heuristic Evaluators
Introduction
Since the lo-fi prototyping stage, we have created two versions of the interactive prototype. The first version consists of the initial design we developed in response to the results of the lo-fi prototypes, effectively a combination of features from each interface tested. The second version consists of the current design developed in response to the complications created by this first version. It is the second version that is storyboarded (Powerpoint) and presented (Ruby on Rails) here.
First version development
While we always knew our potential users had different sets of goals, testing of the lo-fi prototype demonstrated that these potential users in fact have conflicting goals. In general we have two sets of potential users, which are best described using our personas. One group, the Ted Sinclairs, are “power naturalists” that observe and record a lot of information about their observations in nature. The other group, the Jenny Takahashis and the Adam Thompsons, are more casual naturalists that enjoy exploring and recording select amounts of information about their observations in nature. When our representative participants interacted with the two lo-fi prototypes (the any-order and the map-first interfaces) the Ted-like participant preferred the any-order interface because it allowed him to add observations more efficiently, meanwhile the Jenny and Adam-like participants preferred the map-first interface because it was more interesting and fun to use. Therefore, we decided to incorporate the important features of each group: a map-first interface as well as batch adding and default-setting capabilities.
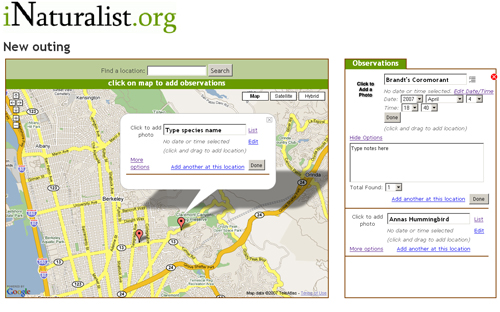
Version 1 of the First Interactive Prototype
Second version development
However, after beginning to develop this interactive prototype we realized that batch adding and default-setting features unnecessarily complicate the interface for casual users like Jenny and Adam. We decided that these features specific to the power naturalists would be better represented in a separate interface. Therefore, the second version of the interactive prototype consists of the map-first interface in addition to a simplified version of the date and time entry components. (Batch-adding of species by selecting from a list has been removed). This version is described in greater detail in the Changes Since Lo-fi Testing and Implemented User Interface and Screenshots sections of the write-up.
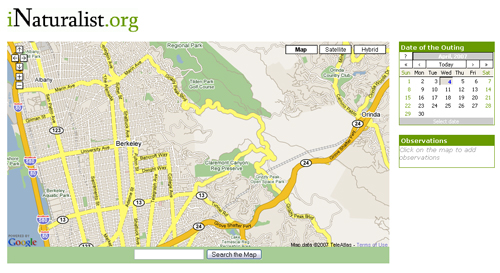
Version 2 of the First Interactive Prototype
Revised Interface Design
Representative Scenarios
Our three task scenarios are as follows. While the first two scenarios are adopted from the low-fi prototype, the third scenario was created to represent the ability to edit the location of an observation.
- You went bird watching at Charles Lee Tilden Regional Park (located in the Berkeley hills) on a Saturday morning (3/31/07). You saw an Anna's Hummingbird. Go to iNaturalist and add this observations to an outing.
- The following day you have uploaded your Tilden photos from your camera. You took a digital photo of the hummingbird. Edit the observation to include the photo.
- You also realize that you saw the hummingbird closer to Lake Anza (the big lake in the middle of Tilden Park). Move this individual observation to a more accurate location.
Changes Since Lo-fi Testing
As a result of the lo-fi testing and subsequent feedback, we originally decided to implement a combination of the interfaces tested. We maintained the interaction flow of the map-first interface, but made batch-adding of observations and setting of default date and time for an outing possible. Since that time, while we have maintained map-first flow, we have removed the batch-adding of observations and default settings, separating time and date. We also considered changing previously utilized "outing" and "observation" terminology, but have decided to keep this vocabulary for our interactive prototype.
Not only did we choose to implement the map-first interface because our casual naturalist enjoyed the experience provided by the interface, but we also considered the feedback provided by John Mark for the lo-fi prototype. John Mark described his experience with the Lights On project: their users preferred a predetermined task selection order to an unrestricted order (where users were free to select tasks in any order). This was because the predetermined order provided their users with guidance in completing their tasks, and without this guidance users were confused about how proceed when selecting a task. Therefore, in our situation, by designing a map-first interface, users must first click on the map in order to add an observation. Once users click on the map, they are provided with a callout that allows them to add other components of their observation, such as photos, species name, time, and additional text. By limiting the order that users can submit their data, users are provided with greater guidance in recording their information.
As we developed and tested the interactive prototype, we decided to allow users to add and edit observations in only one location, the map callout, instead of either in the callout or in the list on the right-hand side. If this callout is not currently visible, the user can access it by clicking on the map marker associated with the observation or clicking on the specific observation located in a condensed list of observations, which displays the species name. This modification provides users with an established location to create and modify observations. In the interactive prototype we also decided to condense the list of previously created observations. This change allows the map, rather than the observation list, occupy the majority of the interface space, and eliminates the confusion of having multiple locations for editable content.
Another modification we made after beginning development of the interactive prototype is the separation of date and time information. In the current version, time is still associated with individual observations, but date information has been pulled out to become an attribute of outings, which contain multiple observations.
We have not decided to change is the "outing" and "observation" terminology. John Mark also provided helpful feedback in response to the confusion created by this vocabulary: he suggested that we replace the term "outing" with "a group of observations". While we considered his suggestion, we have decided to keep the original terminology because the terms are meaningful to our potential users. In our initial interviews and lo-fi testing we learned that many naturalists make their observations during discrete outings, so while the outing/observation distinction may seem vague to the general observer, the two concepts map directly to the experience of our potential users.
Scenario Storyboards
A pseudo-interactive storyboard of our scenarios is available here. While these storyboards had been sketched out and determined ahead of time, we took Marti's advice and implemented them in PowerPoint to more clearly communicate our interface's interactivity than possible in our web implementation given the time allotted. (To implement our interactive prototype in Rails from the start was, we realize, ambitious.)
Scenario One
First, a date is selected for the outing via the calendar in the upper right. Next, clicking on the map adds an observation to the outing. The species name is typed in the top text box, the date is edited, and clicking "Done" adds the entry to the condensed list (and would close the callout, though this does not happen in the slideshow).
Scenario Two
Clicking "Click to Add a photo" brings up a lightbox to browse for a photo to upload.
Scenario Three
Clicking and dragging the observation marker on the map associates the observation with a new location.
Prototype Overview
Implemented User Interface and Screenshots
The following screenshots demonstrate the actual implementation of the representative scenarios. The screenshots of Scenario One demonstrate the interfaces' ability to select the date and location of the observation as well as add observation data such as the species name and any associated text. The screenshots of Scenario Two demonstrate the interfaces' ability to select an existing observation and add a photo to the observation. The screenshots of Scenerio Three demonstrate the interface's ability to select the location of an observation and drag the observation to a new location.
Scenario One
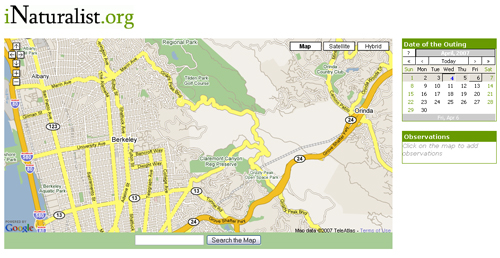
The initial screen displays the map, an empty observation box, and a calendar without the date selected
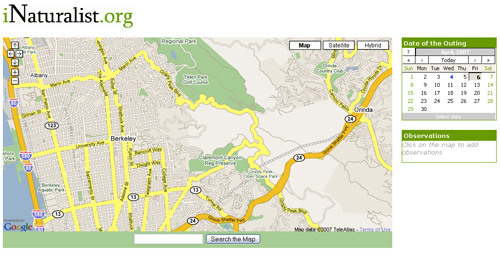
A date (Friday April 6, 2007) is scrolled over
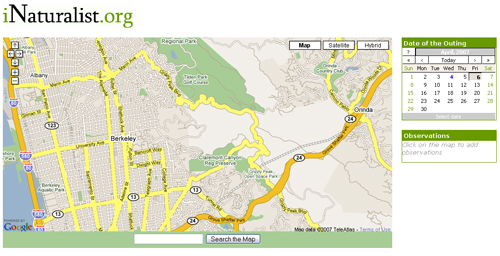
A date (Friday April 6, 2007) is chosen
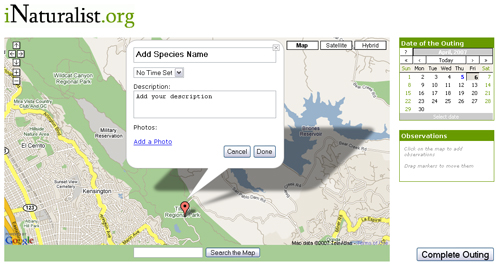
A location within Tilden Park is selected and a call out appears
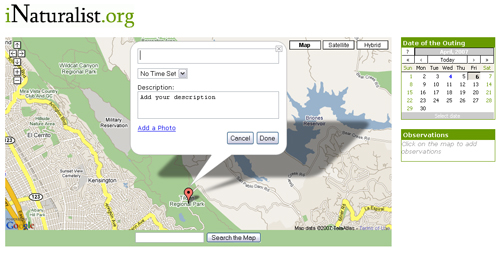
The text box containing "Add Species Name" is clicked
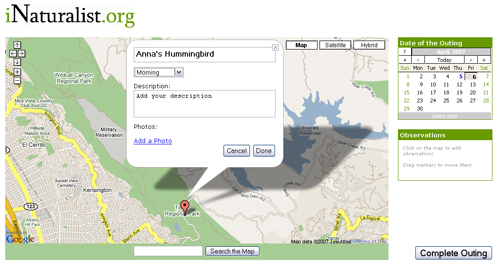
A name (Anna's Hummingbird) and other observation data is entered
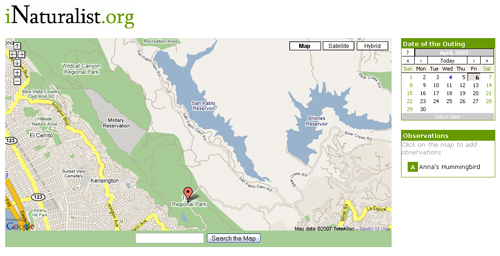
The observation is completed by clicking "Done" and the observation is populated in the observation list
Scenario Two
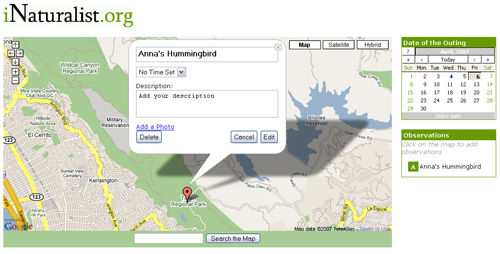
The observation is selected by clicking on the map marking and the observation callout appears
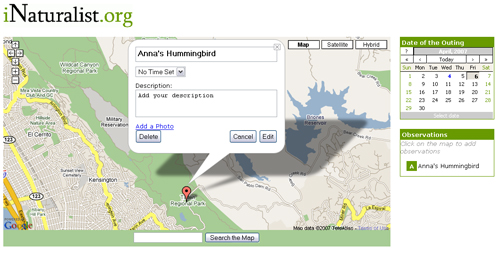
The observation is also selected by clicking in the observations list and the observation callout appears
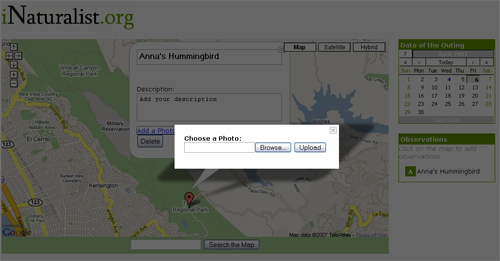
The link "Add a Photo" is clicked and the choose a photo lightbox appears
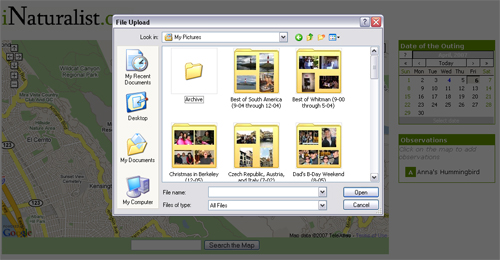
The "Browse" button is clicked and a file upload window appears
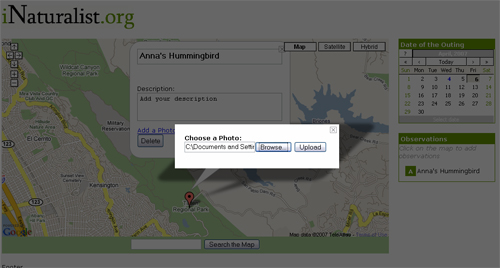
A photo is selected and the choose a photo lightbox reappears with location of the selected photo
Scenario Three
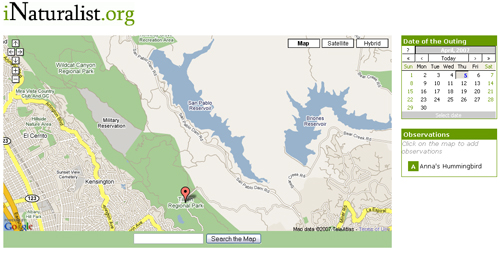
The observation location is selected by selecting the map marking
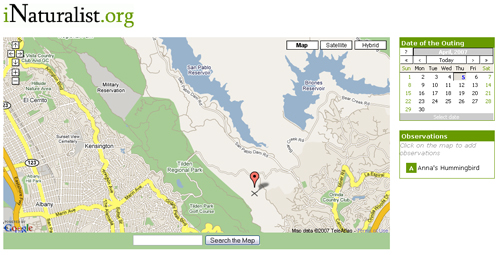
The observation is dragged by moving the map marking
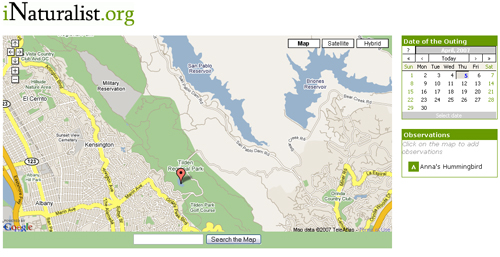
The observation placed in a new location
Omitted Functionality
The interactive prototype does not include functionality intended for power naturalist such as (Ted Sinclair) as well as omits the iNaturalist welcome page. Although these features are excluded from this interactive prototype, we hope to design and prototype them at a later date in order to include them in future interactive prototypes.
The power naturalist functionality includes batch adding multiple observations, selecting a location using GPS coordinates, and searching for named locations not recognized by Google Maps. The batch adding feature was omitted from the first interactive prototype because we determined that it requires a separate interface from the general observation adding interface. As described in the introduction, in our lo-fi prototype we discovered that our personas have conflicting interface needs. Initially, we hoped to include include functionality that would integrate the needs of both parties. However, we later realized that such integration detracted from our general design and determined that the power naturalist interface required a separate interface. Also, through our initial and lo-fi prototype interviews we determined that the GPS and search components are features preferred by power naturalists, and of little use to casual naturalists. As a result, we decided to test and design all of these advanced features at the same time; and therefore, we have omitted these components from the first interactive prototype.
Additionally, at this time the prototype does not support linking multiple observations to one point on the map. We plan to add this in the future, using a condensable/expandable callout list.
The iNaturalist welcome page provides the user with a starting place to add new observations and edit existing observations. While this page has the potential to be an important component for future iNaturalist interfaces, it is not essential to the goals of our personas. Therefore, because the goals of our personas are to add their observations in nature, we have omitted this component from the first interactive prototype.
"Wizard of Oz" Techniques
- Currently the application has no state. All data are stored on the client side, and disappear when the page is reloaded.
- Clicking "Upload" in the photo upload dialog simply closes the window, and does not yet add a photo to the observation. Imagine a cute bird appearing in the map callout, as in the storyboards.
- Clicking "Complete Outing" simply shows an alert signaling completion, instead of routing the user to another page and commiting data to a database.
Known Bugs
- The interactive prototype does not work in Internet Explorer or Safari. Firefox is the preferred browser at present.
- Time is not stored, and thus closing a callout, then re-opening it by clicking on its marker or its entry in the condensed list will erase time information.
- In some browsers, text in textboxes (e.g. species name) will mysteriously disappear when the user clicks outside then back in the textbox.
Tools Used
The tools we have used for the first interactive prototype include Ruby on Rails, Dreamweaver, Inkscape, and Powerpoint. Ruby on Rails is a web application development framework and was userful in providing basic scaffolding and templates for the application. It also integrates Javascript helper and effects libraries like Prototype and Script.aculo.us that eased much of the interaction develpment. Occasionally the level of abstraction in Ruby on Rails was actually a hindrance. We were often at a loss to find documentation on doing something "the Rails way" and had to resort to coding Javascript directly, which is most likely the cause of our lack of cross-browser compatability. We relied heavily on the Google Maps API for the map and associated elements, like the markers, marker dragging, map search, etc. Dreamweaver was a useful tool to for writing some of the html and CSS used in the design; it provided useful feedback when searching for the appropriate tags and attribute names.
Work Contribution
| Task | Andrew | Jess | Ken-ichi | Nate |
| Design decisions and planning | 25% | 25% | 25% | 25% |
| Markup code | 35% | 35% | 15% | 15% |
| Interaction code | 0% | 0% | 30% | 70% |
| Application code | 0% | 0% | 50% | 50% |
| Powerpoint storyboards | 100% | 0% | 0% | 0% |
| Presentation | 25% | 25% | 25% | 25% |
| Write-up | 15% | 75% | 10% | 0% |
Instructions for Heuristic Evaluators
- The interactive prototype is located at the following address: http://dev.inaturalist.org/outings/new. If the link does not work please contact Ken-ichi (kueda@ischool.berkeley.edu, feel free to phone too. His number's on the wiki). Test to see if the site is up and contact him if it's not about a day in advance.
- We understand that it was ambitious to implement this prototype as a functional web application, and the prototype is therefore limited. Basic functionality is there, but it does not necessarily look how we intended. Please refer to the PowerPoint storyboards to help resolve questions about functionality and flow that may arise as a result of bugs in the implementation.
- The interactive prototype scenarios are located in the Assignment 5 write-up.
Attachments
- version1 interactive.jpg (164.4 kB) - added by jess on 04/04/07 19:02:03.
- multiplecallout.jpg (69.4 kB) -
planned scrolling interface for multiple observations at one point
, added by mcd on 04/04/07 21:34:09. - listadd.jpg (46.3 kB) -
planned interface for batch-adding observations by pikcing multiple species from a list
, added by mcd on 04/04/07 21:44:43. - version2 interactive.jpg (159.0 kB) - added by jess on 04/04/07 22:51:01.
- Initial screen.jpg (156.4 kB) - added by jess on 04/04/07 23:18:55.
- Scroll over date.jpg (153.7 kB) - added by jess on 04/04/07 23:19:23.
- Date chosen.jpg (153.7 kB) - added by jess on 04/04/07 23:19:46.
- Text field clicked.jpg (127.7 kB) - added by jess on 04/04/07 23:20:21.
- Data completed.jpg (132.5 kB) - added by jess on 04/04/07 23:20:48.
- Observation selected option1.jpg (131.6 kB) - added by jess on 04/04/07 23:50:07.
- Observation selected option2.jpg (131.3 kB) - added by jess on 04/04/07 23:50:16.
- Click add a photo.jpg (103.0 kB) - added by jess on 04/04/07 23:50:37.
- Photo upload.jpg (128.6 kB) - added by jess on 04/04/07 23:50:55.
- Photo selected.jpg (103.5 kB) - added by jess on 04/04/07 23:51:06.
- Click on location.jpg (132.3 kB) - added by jess on 04/04/07 23:51:25.
- New location.jpg (136.2 kB) - added by jess on 04/04/07 23:51:34.
- Observation dragged.jpg (144.0 kB) - added by jess on 04/05/07 00:28:53.
- Observation placed.jpg (143.1 kB) - added by jess on 04/05/07 00:28:59.
- Location selected.jpg (131.3 kB) - added by jess on 04/05/07 00:29:12.
- Location chosen.jpg (136.0 kB) - added by jess on 04/05/07 07:45:43.
- Data entered.jpg (136.3 kB) - added by jess on 04/05/07 07:45:58.
- Data entered.2.jpg (136.3 kB) - added by jess on 04/05/07 07:46:50.
- Location chosen.2.jpg (136.0 kB) - added by jess on 04/05/07 07:47:33.
