Work Distribution/
Revised
Personas
Competitive
Analysis
Initial Design Ideas: Brianna Bridger
Competitive Analysis
Road Sage offers two key advantages over the competition:
(1) Estimated Travel Times with Traffic Intelligence. None of the current
working applications for travel planning factor traffic into travel time
estimates. Many of our interviewees, for example, expressed frustration
with MapQuest and Yahoo! Maps for always having inaccurate travel times.
(2) Predictive Traffic Intelligence. Though applications like KTVU.com,
SF Bay Traffic.com and SF Gate provided real-time traffic data, none of
the current applications go the next step of analyzing historical traffic
patterns to predict future traffic. Our application has the advantage
of
drawing upon a large set of archived traffic data to extract typical
traffic patterns, so the person who wants to drive to an interview Tuesday
10AM in San Jose can plan ahead of time for what the traffic will
typically be like along that route.
Related work has been performed in the Department of Electrical
Engineering and Computer Science at Berkeley. A group of researchers
there have worked on predictive travel time estimates and optimal routing
based on traffic as part of the Freeway Performance Measurement System
(PeMS). Much of their work has been published in detail in papers located
on the PeMS website (). These papers include algorithms for traffic-based
travel time predictions; philosophical strategies for traffic systems;
and
the structure and setup of Caltrans traffic sensors along Bay Area
highways.
Yahoo! Maps and MapQuest
Both of these applications provide street maps and driving
directions for US cities. Most
of the users we interviewed currently use Yahoo! Maps and MapQuest in
their travel planning tasks.
Both tools provide well-designed, focus+context visualizations of driving directions. Textual address-to-address directions augment a visual map that highlights the user's entire route. Yahoo! Maps adds the additional focus feature of zooming in on the last few blocks of the trip. In MapQuest, the map appears below the complete printout of directions. In both applications, users can generate driving directions by entering their start and ending addresses in several forms: street address, intersection, zip code or city. The flexibility of the tool allows users to quickly generate accurate and customized directions.
Yahoo! Maps Screenshot: Focus + Context Map with
Driving Directions
MapQuest Screenshots: Focus + Context Driving Directions
with Map
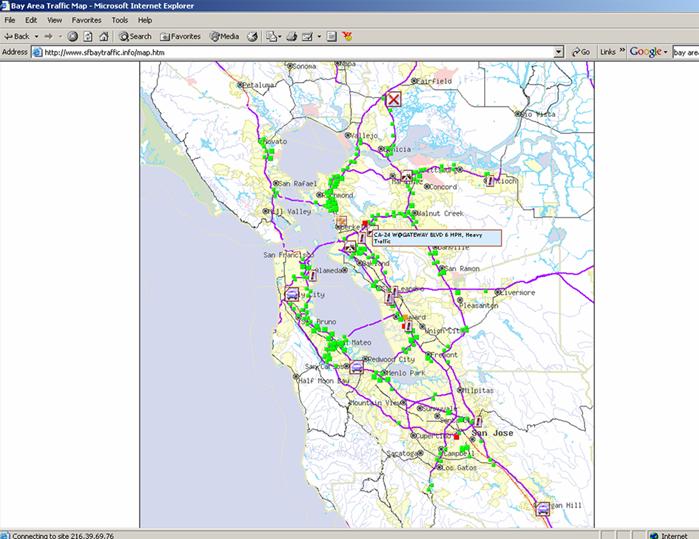
SF Bay Traffic.com
This website provides live traffic updates on the front
page. To view more information,
the user rolls his/her mouse over the icons.
SF Bay Traffic.com Screenshot: Real-time Textual Traffic Updates
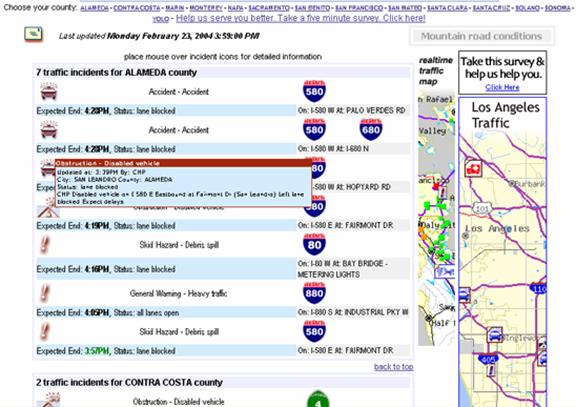
- Green dots along a freeway indicate low traffic;
- Red dots indicate slow-moving traffic;
- "!" icons indicate skid hazards;
- "X" icons indicate emergency road obstructions;
- Highway icons indicate disabled vehicle obstructions;
- Automobile icons indicate accidents.
Mouse rollovers provide detailed information about each event.
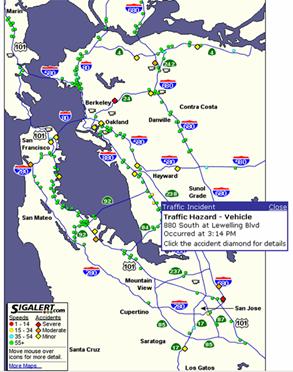
KTVU.com Bay Area Traffic Watch
KTVU.com provides an online map for live traffic incident reports and freeway flows. Information is visualized on the map as follows:
- Circles along each major highway indicate speeds. The color of each circle differentiates speeds. Green is fastest and red is slowest.
- Diamonds indicate accidents. The color of each diamond represents the severity of the accident, where red is severe; orange is moderate and yellow is minor.
Mouse rollovers provide detailed information.
KTVU.com Screenshot: Real-time Traffic Map
 |
SF Gate Live Traffic Feeds
SF Gate provides a real-time, textual list of traffic
incidents on Bay Area freeways, as reported by the California Highway
Patrol. The list provides street names where accidents
have been reported; users can click the accident summary for additional
details and police officer involvement.
SFGate.com Screenshot: Traffic
Incident Report