Introduction,
Task Flow,
Work Distribution
March 11, 2004
Introduction
We are building an interactive web-based tool to help users optimize
their
commute through more informed trip planning. The main component of the
system is an interface with a map servlet, on which users can
select the day of the week and the time when they plan to travel, as well
as the
point of origin and the destination. In response, the system displays
the
estimated travel time for the planned route, as well as a map of Bay
Area freeways, color-coded according to the average speeds that are usual
for the selected time of day. The most optimal route is also highlighted
on the map; in addition, the system displays a list of other possible
routes, if any, with estimated travel times.
The purpose of lo-fi testing was to ensure that the interfaces and the
workflow we had envisioned make sense to real users who had not
been initiated into our system and who may or may not be completely
proficient with web-based tools in general. Seeing how users learn their
way around the system, what confuses them, and what features they prefer
has been an enlightening and useful process.
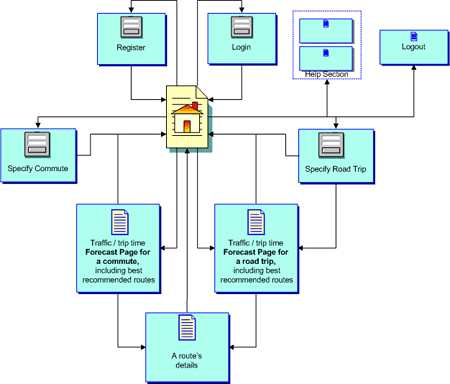
Initial Interaction Flow

Work Distribution Table
Sean |
Lauren |
Mikhail |
John |
|
Interaction
Flow Diagram |
90% |
10% |
||
Task
scenarios |
80% |
20% |
||
Paper prototype |
20% |
40% |
20% |
20% |
Recruiting
users |
66% |
33% |
||
Testing |
25% |
35% |
15% |
25% |
Writeup |
40% |
40% |
10% |
10% |
Website |
80% |
20% |