Initial Design 3
The flow chart (Fig. 1) demonstrates how the new pages intergrate into the existing IMG structure. Access to the Annotation page is granted upon login. (Non-registered users will not be able to modify annotations.) New pages are marked by bolder borders, the annotation page is highlighted in light blue.
This design (Fig. 2) does not have a rating system, but rather lists number of annotations that the user has done and how many of them have been modified by others (upper right). By doing so it provides unobrusive feedback on the status of past annotations. There is also a link to "My Annotations" page that provides a list of past annotations from which the user can jump onto specific Annotation pages for the genes that he/she did in the past or the ones that have been changed.
The data elements are groupped in horizontal sets and separated by the lines. The first set are they key data the must be filled in. Additional data entry fields follow (KEGG, COG, GO, etc.) A quick history summary appears at the bottom right next to the Comments field. It provides the top level overview of how the gene record has been modified in the past. More information could be obtained by going to the Full History page (new).
Figure 1: Flow Diagram
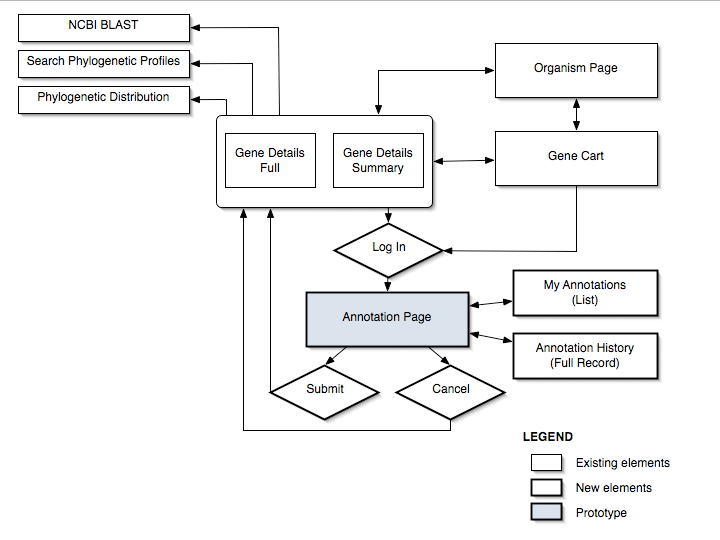
Figure 2: Annotation Page
