Usability Study Results
ParticipantsFive participants responded to an email solicitation to test a low-fidelity prototype of the PhotoArcs interface. Two participants are female and three male; four are MIMS students (three in the class of 2006, one in the class of 2007) and the fifth has a PhD in computer science. All are digital photograph enthusiasts, taking many digital photographs on trips, at special events, and (for some) even day-to-day, which matched our target audience very well. Participants were asked to provide digital copies of between 20 and 30 of their own images for the study, preferably from one event or two related events. Participants were not compensated for the study.
Method
We chose to conduct our usability studies with a low-fidelity prototype of our interface in order to allow a richer set of interactions than those implemented in our coded prototype. Our low-fidelity prototype consisted of a foam-core board, strips of yarn and ribbons of fabric in various colors, squares of paper in various sizes, and print-outs of the digital images that the participant provided before the study. We also had scissors, tape, pens, and push-pins on hand and invited the participant to use them if they wished.
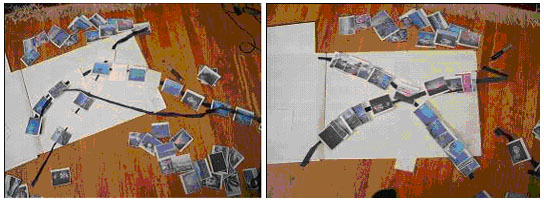
Figure 12. Our low-fidelity prototyping materials, put to use in a pilot study/brainstorming session
Because we believe that our interface should support intuitive interaction, we wanted to conduct our tests so that we could observe the ways in which participants intuitively interacted with their PhotoArcs. To do this, we let participants manipulate the interface components directly, only intervening when participants got stuck or veered far from our goal of supporting photo-narratives. In contrast, in standard low-fidelity testing, participants illustrate what they want to do to the study facilitators, and then the study facilitators perform those actions themselves [9]. We felt that our method would also allow us to observe what interactions the participants felt were most intuitive, rather than simply how they reacted to the interactions we had decided on. Though this technique did introduce a degree of uncertainty and variation, as described below in the results section, it did indeed provide us with valuable information on how accurate we were in our design ideas for supporting intuitive interaction.
We developed a script for our interface evaluations which we followed loosely during the usability studies. While we made sure to cover all of our questions, we were flexible about the testing process, inquiring about and documenting the spontaneous interactions chosen by the participant. The tasks we asked our participants to execute were:
- Upload pictures into the system
- Create a new arc
- Add a photo to an arc
- Add text to an arc
- Remove a photo from one arc
- Delete a photo from the system
- Change the order of photos
- Read and comment on a friend’s arc
- Look at a photo’s details
- View all arcs (imagining that the participant has many)
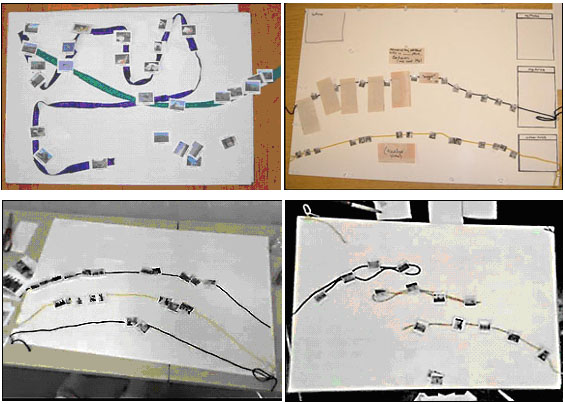
Figure 13. PhotoArcs created by four of our five participants: a) top left, b) top right, c) bottom left, d) bottom right.
Since PhotoArcs presents a novel way to create and organize photo narratives, we kept our interface testing very open and flexible, allowing the participant to direct their interactions and play with the metaphor of the arc. We also focused exclusively on getting qualitative feedback from participants, since quantitative information such as the amount of time a task took was neither as relevant for this interface as it is for others (as long as the times are not exorbitant) or possible to test using a low-fidelity prototype. We also took pictures of the participants’ arcs as they created them (see Figure 13 for examples).
Overall, user response was positive. All participants said that they would like to use the PhotoArcs system and, assuming that interaction was as seamless as they expected it to be in the low-fidelity prototype, they preferred it to current methods of online sharing. The tasks we asked participants to complete were designed to answer the following questions about our visualization:
Do users want to the ability to create a linear narrative with their photo collections?
Overall, the five users we tested liked the idea of being able to create linear stories of events. One participant mentioned that he would love to use PhotoArcs to store and share his son’s soccer games, while another stated that she would use it to chronicle her many hiking ventures. Another stated her “initial model was that others could add photos and captions to the same arc.”
Is the metaphor of an arc for photo narratives intuitive?
All participants liked the idea of an arc to represent a narrative. They easily manipulated the arcs of yarn during lo-fidelity usability testing, as they arranged photocopies of their thumbnails to tell their stories. Other desktop metaphors interacted well with the arcs. Three participants suggested a scissor tool to cut a PhotoArc into two, and four wanted to delete photos from a PhotoArc by dragging it to a trash can icon.
Do participants want uploaded photos to be automatically organized into PhotoArcs? If not, what behavior would they desire upon upload?
Three participants liked that uploaded photographs were automatically put on an arc. Two said they would prefer to have a bin or workspace for uploading and the ability to drag photos onto arcs (where a copy of the photo would remain in the bin, but marked as having been used on an arc). All participants wanted the chronological order of their photos to be preserved when the photos are uploaded, and several wanted filtering to get rid of undesired pictures.
Do participants want intersecting arcs to represent intersecting narratives?
One participant latched onto the idea of PhotoArcs intersecting each other at different points where they have photos in common (Figure 13a), which is the interface design we imagined. However, the other four participants thought intersecting arcs were confusing (Figure 14). Instead, they preferred parallel arcs with photos that line up according to time (Figure 13b). Thus, they suggested that spacing between photos be determined by when they occur, resulting in clusters of photos on different arcs spaced according to time intervals. One participant suggested organizing and displaying the PhotoArcs by month, which we have integrated into our timeline overview (Figure 8).
Figure 14: an example of how intersecting PhotoArcs could be particularly confusing
How do participants want to add text?
Participants gave varied responses regarding how they would like to add a caption or annotation. Two mentioned wanting to right-click on a photo. One of these two said they would then want the text box to open in the center of screen so he could type the text, then attach itself to the selected photo when he was done. The second person said the textbox should open next to the photo so she could type her text and then close it.
Two participants said they would prefer an annotation tool to create captions. All said they would like to treat text boxes as independent from their photos. One participant suggested a “group” and “ungroup” tool that would allow her to move clusters of photos, and color-code boxes for categorizing.
All participants wanted to add a title and a short description to an arc. One said she would like to display a “summary nugget” but hide the rest of the text, and another suggested incorporating the functionality of a Word document that automatically generates the summary of a PhotoArc for you.
Do participants want the ability to add comments to friends’ narratives?
All participants agreed that comments are useful for commenting on narrative. One participant independently said that it would enable interactive storytelling.
Do participants want different levels of privacy for sharing PhotoArcs to their bosses vs. their friends?
Some participants wanted different filters for different audiences, but others said they would simply send different PhotoArcs to different people.
Do participants want the capability to add metadata to PhotoArcs, to individual photos, and to text boxes?
All participants said they would like to be able to add metadata to facilitate searching and organization. One participant wanted the ability to create new arcs from a tag and to tag all at once.
Other Findings and Comments
- All participants wanted an overview view of a PhotoArc that provided a summarized version of the photos and captions. One participant said that he would like a “zoom out view” to see pictures of his son’s entire fall soccer season. He also wanted see light grid determining time in the background, with the option to turn the grid on and off.
- One participant had the novel idea of shaping PhotoArcs in the form of a dramatic arc that features a starting point, conflict, climax, etc. For example, a PhotoArc could display a high point, like a vacation, as a peak, and a low point, such as a bad family gathering, as a dip in the arc.
- Another participant suggested having a ratings system. People could rate their favorite arcs or have people vote for their favorite photo in the arc.
- One participant wanted to be able to create arcs by drawing a line intersecting photos. He also wanted to be able to arrange arcs into distinctively-shaped “glyphs” that could help him identify arcs when zoomed out. He suggested having a view where miniature glyphs are displayed on a linear timeline.
- Some participants wanted information on the number of times a photo or arc has been viewed, similar to the statistics that Flickr keeps. One suggested an information pane in the interface that displays metadata when a caption or group of photos is selected, along with comments and number of times shared.
- One entrepreneurial participant said he would commercialize PhotoArcs in the following manner: let users do some cropping and optimization (would like ability to edit photos, but nothing fancy), add text to each photo and a title (or overarching description to arc), and send URLs to friends and family for $20/year.