
Revisions
As part of the feedback we received from our first round of prototype testing, we made some crucial changes to the work flow of our system. Perhaps most drastic was the removal of the lighting group system. These changes are discussed in the following sections.
Revised ScenariosRevised Tasks
You are a building manager who is responsible for reporting lighting problems to the building electricians. It is first thing Monday morning and you want to use the system to discover any lighting failures that occurred over the weekend.
- Find out which lights are broken.
- Please identify which lights broke over the weekend, Saturday, March 3rd and Sunday, March 4th.
- Which lights have been broken the longest?
- Which lights still need your attention?
Task 2:
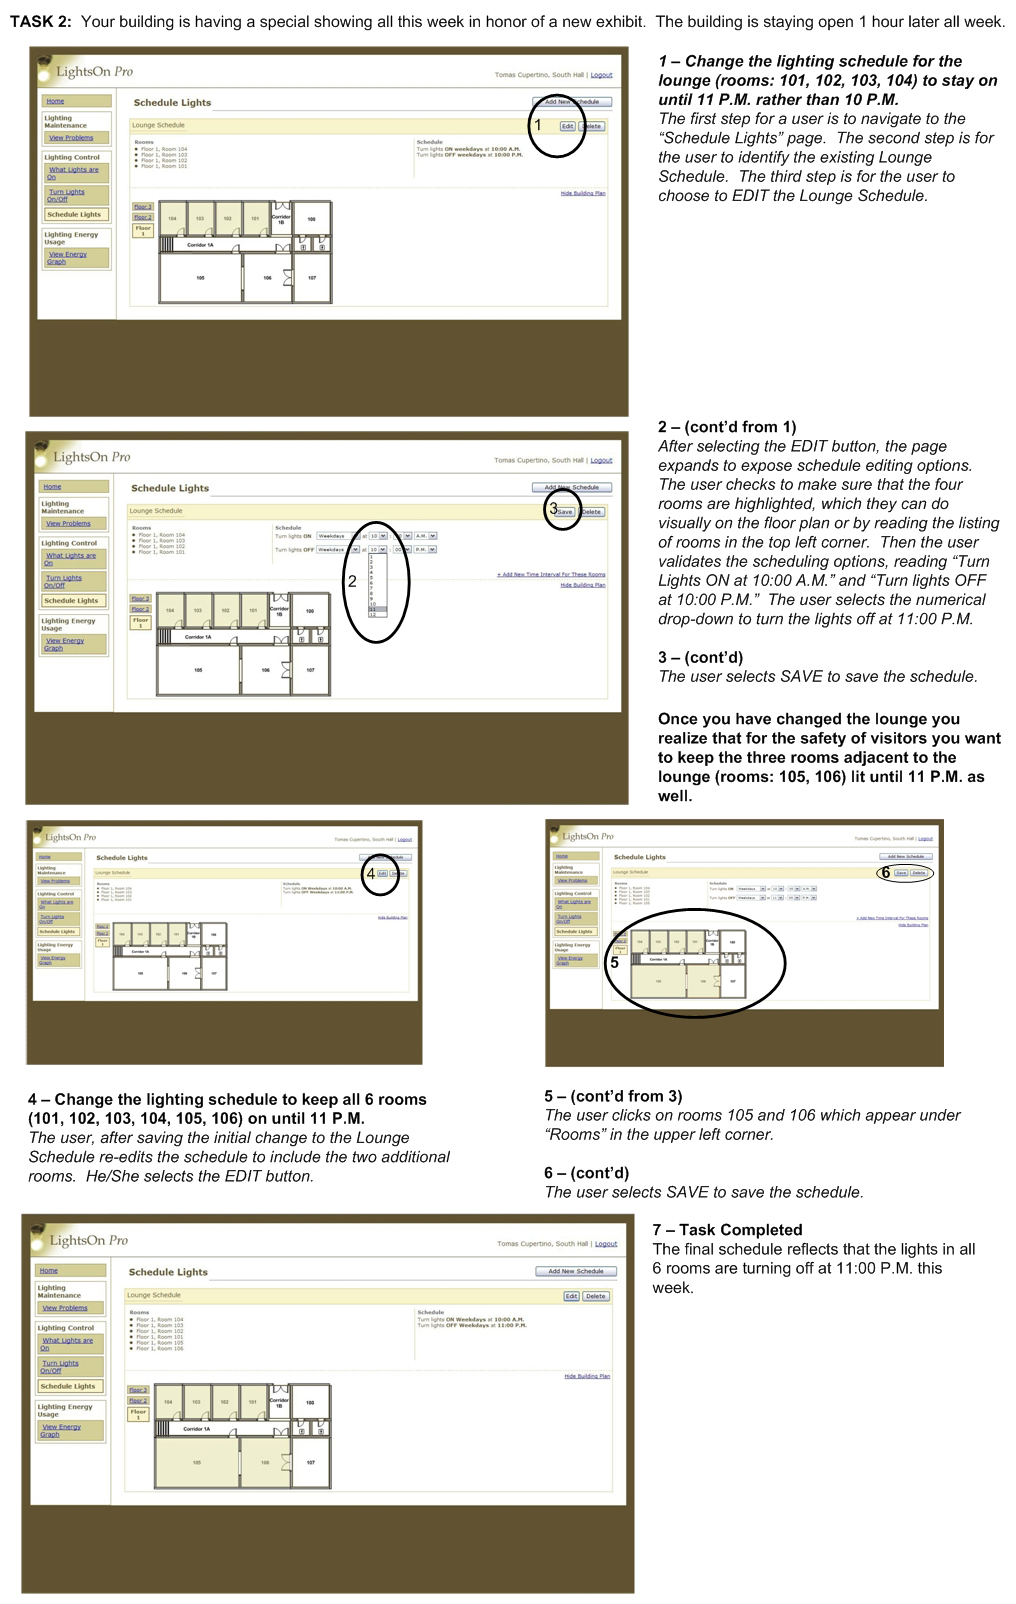
Your building is having a special showing all this week in honor of a new exhibit. The building is staying open 1 hour later all week.
- Change the lighting schedule for the lounge (rooms: 101, 102, 103, 104) to stay on until 11 P.M. rather than 10 P.M.
- Once you have changed the lounge you realize that for the safety of visitors you want to keep the three rooms adjacent to the lounge (rooms: 105, 106) lit until 11 P.M. as well. Change the lighting schedule to keep rooms all 6 rooms (101, 102, 103, 104, 105, 106) on until 11 P.M.
Task 3:
The company picnic is tomorrow so everyone took off early and is obviously in a rush. You realize you are the last one out of the building, but several of the building's lights are still on.
- Turn off all the building's lights except your own, room 101
- You decide maybe it would be best to turn the first floor corridor (1A) lights on so you can find your way out safely. Turn corridor 1A's lights on.
Task 4:
Earth Week is next month so you decide to check on the lighting energy usage and inform the staff about this month's progress.
- Has the lighting energy use gone up or down from last month?
- How does energy usage for this month compare to this month last year?
Differences Between Lo-Fi and Interactive Prototype
Naming Convention and PagesThere were two page names we changed. First, we changed View Light Problems to View Problems because Light was assummed by the page's grouping under Lighting Maintenance. Second, we changed View Interactive Graph to View Energy Graph because the importance of the page was in seeing energy usage not in the graph's capability to be interactive.
In the Lighting Control group, we decided to combine the notion of Grouping and Scheduling into one page, thus discarding the Group page. During low-fi testing, we realized that it was important for users to be able to see what lights are currently on in the building; the change is reflected in the What Lights are On page.
Grouping and SchedulingTo address the user frustration with the notion of grouping and scheduling lights, we collapsed the two pages into one functional page. Therefore, the Scheduling page had the most drastic makeover of all pages since low-fi prototyping. To fix this disconnect, we collapsed the functionality of grouping and scheduling into one page with the title "Scheduling". The team split into two groups for a parallel design activity, reconvened in order for each group to propose their solution and then aggregated the best ideas for implementation. The outcome is a scheduling page in which there is an initial wizard - to assist the user in creating a new schedule-, and a listing of existing schedules. Unlike the low-fi prototype, there is no notion of a group of lights until a schedule has been created. Additionally, there are ample visual cues to assist the user in selecting rooms to apply a schedule; the floor plans are displayed, one floor at a time, for the user to interact with, clicking on specific rooms to add to the schedule. To switch from one floor to another we used an elevator metaphor running vertically alongside the visual floor plan. Floor 1 is displayed beneath Floor 2, which is beneath Floor 3, and etc.
Energy GraphWe also made some adjustments to the graphing page in order to make the functionality clearer to the user. We simplified the drop-down menu options, and included an explicit comparison option through a drop-down menu as well, rather than a checkbox. We maintained the graph view as plotted points because it made the most sense to our users viewing energy usage over a specified time interval.
During low-fi prototyping we had encountered a discrepancy between user opinions of the graphing page. Our experienced user felt that comparing week to previous week or month to previous month was not as useful as comparing month to same month last year. Conversely, our less experienced users who act as building coordinator for only a few years thought the existing comparisons were just fine; they wanted to measure smaller increments of improvement. As a design team, we decided to accommodate both types of users by creating a second dynamically filled drop-down menu. Mentioned previously in handling participant frustration after low-fi prototyping, we fill the drop-down with three choices: None (default), Same {day, week, month} Last Year, Last {week, month, year}.
DashboardThe HTML prototype displays dashboard naming convention changes and widget reduction. First, Recent Lighting Problems is renamed to Unresolved Lighting Problems. In this widget, rather than having red text that reads [New] to indicate a new lighting failure, we adopted a three-flag system: Red Exclamation, Yellow Flag and Green check mark. This three-flag system is copied over to the View Problems page under Lighting Maintenance. While the icons can be toggled on the View Problems page, they currently cannot be toggled on the dashboard. We hope to fix this problem in a future version.
The display of data about each lighting problem was also changed to fit into a table-like format, where data about when the problem occurred and where the problem exists are displayed side by side rather than on top of one another. Additionally, at the bottom of the widget, along with the link to view all problems on the View Problems page, we included a note that indicates the number of additional unresolved lighting problems. Currently the widget only displays a maximum of 3 problems, this number displays if there are more light failures that are not displayed on the dashboard widget.
Second, the widget labelled Lighting Energy Usage Trends changed slightly; we removed the option for the user to change the default setting for this widget on the dashboard. Instead there is only just one link to take the user to the View Energy Graph page. The text for this link was changed from View Interactive Graph to reflect the same change made to the sidebar menu option.
The third widget was labelled What Lights are On from the more verbose What's On in My Building. We added some header titles, Where and Energy Usage, to provide more information to the user about the visual graph dispalyed. Since there is a 4 room cap on dashboard display, we also include a note that points out the number of additional rooms with lights on as well as a link to view the entire page What Lights are On. The widget shows the top 4 by current energy useage.
The fourth widget has changed from Lighting Usage Change to Overall Change. It retains the large arrow which points up or down to reflect an increase or decrease in energy usage from this month compared to the previous month. We removed the option to change this widget's default setting.
Finally, since our primary persona, Tomas, is only responsible for one building, we removed entirely the widget labelled Lighting Efficiency Rank. This widget was originally intended to let the user see their building in comparison to other building's based on energy usage. The scope of our interface is to address one building at a time, so this widget was unnecessary.
Lighting Maintenance: View ProblemsSome major changes were implemented for the Lighting Problems page. First, rather than having all floors displayed at once, we display one floor at a time with links to view every other floor listed on the side. These links make use of an elevator metaphor so that they are displayed in a stack with the first floor on the bottom. The lighting problems are still listed alongside the left of the floor plan, but rather than labelling new problems with a [New] tag, each problem is given a red exclamation point as it appears. Users can then toggle the red exclamation point to a yellow flag based on their own criteria; we did not assign any semantic meaning to the flags, rather allow each user to do so. Additionally, there is a green check mark that appears in place of either the red exclamation mark or the yellow flag when the system detects that the light is now working. The View Problems page now keeps a log of every lighting failure that has occured.
Storyboards
You are a building manager who is responsible for reporting lighting problems to the building electricians. It is first thing Monday morning and you want to use the system to discover any lighting failures that occurred over the weekend.
Your building is having a special showing all this week in honor of a new exhibit. The building is staying open 1 hour later all week.
The company picnic is tomorrow so everyone took off early and is obviously in a rush. You realize you are the last one out of the building, but several of the building's lights are still on.
Earth Week is next month so you decide to check on the lighting energy usage and inform the staff about this month's progress.
Interactive Prototype
OverviewSince our system has a large degree of functionality, we feel that it is important to test as many of these functions as possible through this initial phase of interactive prototyping. Where most of the widget interaction was difficult to fully test during low-fidelity testing, it is relatively simple to implement and test with the higher fidelity prototype. We tried to implement a complete shell of our LightsOn Pro system, allowing the user to get a "feel" for what can be done in each of the interface's sections. All of the major features have some of their improtant functionality working.
Users can view lighting problems, view which lights are currently on and how much energy each light is using, turn lights on and off, schedule sets of lights to turn on and off at set times and view the buildings energy usage.
What Was Not IncludedThere are a few key features that were not included in this first interactive prototype. For example, we didn't include the ability to save state between pages. Lights turned on in the Turn Lights On/Off page will not be shown as off on the What Lights are On page. Nor do lighting problems that have had their states changed by the user, show up as different in the Dashboard. As a general rule, all changes are lost when you leave the page.
As the interface does not yet connect to a backend that talks to the lighting control units, all components currently display static pre-created data. For example, the energy usage graph on the dashboard is a pre-created static JPEG image. The lighting control page features a hand-crafted image of a building floor layout. Additionally, this current implementation includes code that is specific to this floor layout. In a production version of this interface this code will need to be made robust enough to handle the general case for any building floor layout.
The current energy usage graph uses a 3rd-party Javascript package named XYGraph. However, since it leverages the Vector Markup Language (VML) to draw the actual graph on the page, it limits the deployment of the first interactive prototype to the Internet Explorer browser. For future iterations of ths prototype, alternatives such as generating images on server dynamically or using other Javascript graphing packages are being explored. Other issues that need to be addressed in later interations include cross-browser compatability issues in the current codebase. The graphing functionality also lacks the ability show comparison lines for any time period other than last year. The next version will include both the current energy usage line as well as a comparison line to all previous time periods.
Lighting problems "toggled" on the list do not change state on the floor plan. There is no "next" for the lighting problem log.
The complete Add New Schedule Wizard is not let implemented. (Intended wizard has four steps, mock-ups are included: 1, 2, 3, 4.) Stand in functionality allows for the creation of a new schedule but does not provide the step-by-step guide that we are hoping to add. In addition, only one new schedule can be added, and there is currently no way to bring back deleted schedules. Both of these we hope to change in the next iteration. There is currently no warning presented to the user if they try to navigate away from a modified, but currently unsaved, schedule. We hope to add this basic of error checking.
The Turn Lights On/Off floor plan should have mouse over colors, and the "selected" demarcation should be more clearly visible.
Tools and ShortcomingsThe interactive prototype was developed using HTML, Javascript and CSS. These tools make it easy to construct a navigation system and adjust layout and placement of objects. They also facilitate the creation of interactive widgets; form elements are easy to add and actions can be scripted to hide or expose parts of the page.
The tools do propose some difficulty in building pages that may change arbitrarily. For example, on the scheduling page, the number of possible schedules is large, and it becomes impossible to code for every case using pre-written HTML. In addition, saving data is not an easy task in Javascript, much of the persistent data hads to be written out to cookies.
Graphing using Javascript presented its own unique set of challenges. The language is not very well suited for image creation. We hope in the future to have some of this interaction be handled server-side.
How to Run ItOwing to the the heavy reliance on CSS and javascript, it became difficult to effectively support multiple browsers and platforms. In the interest of time, we limited ourselves to Microsoft Internet Explorer running on Windows XP. In future iterations we hope to offer a wider range of support, but for the first prototype we ask that use evaluate it using I.E. In addition, resizing the browser window may cause the floor layouts to no longer display correctly.
Please agree to any Javascript usage warnings that might occur, these will not appear in the final version.
To begin, click on the provided link and step through Tasks 1-4 listed above:
First Interactive Prototype
Screenshots
Dashboard - lo-fi (old)Dashboard - interactive (new)
Viewing Energy Graph - lo-fi (old)
Viewing Energy Graph - interactive (new)
Viewing Schedule - lo-fi (old)
Viewing Schedule - interactive (new)
Schedule Editing - lo-fi (old)
Schedule Editing - interactive (new)
Schedule Add Rooms - lo-fi (old)
Schedule Add Rooms - interactive (new)
Viewing Lights On - lo-fi (old)
Viewing Lights On - interactive (new)
Viewing Lighting Problems - lo-fi (old)
Viewing Lighting Problems - interactive (new)
Turning Lights On/Off - lo-fi (old)
Turning Lights On/Off - interactive (new)
Work Breakdown
| Ivan Tam | Lindsay Tabas | Katrina Rhoads | John-Mark Josling | |
| Revised Interface Design | 20% | 10% | 40% | 30% |
| Group Management | 0% | 100% | 0% | 0% |
| Interactive Prototype Write-up | 0% | 75% | 0% | 25% |
| Interactive Prototype Development | 25% | 0% | 50% | 25% |
| Class Presentation | 15% | 70% | 0% | 15% |
| Web Page Update | 0% | 0% | 0% | 100% |