Introduction
Web
search engines are essential to web users because they provide an easy way
to locate information on the overwhelming amount of information available.
A useful search engine saves users a lot of time and effort. Many search engines
are now part of portals to drive users to their sites, so having a popular
search engine is valuable
There
is a distinct lack of quantitative research reviewing the search engine industry
at large. A quick count of the major search engines shows that there are many
more than 30 of them; however, a handful of them take up the lion's share
of the market. It is not well known what features users look for when choosing
search engines. The only research of this kind comes from NPD,
a marketing research company which conducts a survey on behalf of subscribing
search engines every quarter. This study, the
"Search and Portal Tracking Survey", is described by self-proclaimed search
engine expert Danny Sullivan as "The
most extensive survey of search engine user satisfaction available."
However,
aside from Danny Sullivan's "Search
Engine Watch" website and the press releases of companies who are happy
with their results (e.g., Google,
and Iwon.com,this
information is restricted to the search engines which have paid for the research,
and a more limited access is granted to the press. In short, with only one
survey reviewing the industry at large, and only of a very limited "group"
of search engines, very little is known about the industry. Further, given
the proprietary and confidential nature of the results, even less is known
by the general public
The
crucial question, then, as this: how much do we know about what people are
looking for in a search engine? Reviewing the NPD survey results, we find
that users are not satisfactorily queried about the various features on search
engines. Is email essential? Is the ability to structure a query in various
ways important? Are contests key? None of this is known, or can be derived
directly from NPD.
Further,
what are the most popular search engines for search? Moving toward other industry
overviews, we find that both MediaMetrix
and Nielsen
Media's "Net Ratings" (Top 10 Web Properties, September 2000) one can
pull out the search engines and come up with a reasonable estimate on the
"top" search engines. The question, however, remains - why do these search
engines dominate? What are people looking for in a search engine? For a new
entity looking to enter the search engine field: What features are essential
to the success of a search engine? What features help create a "favorite"
search site apart from the rest? With an eye toward improving search engines,
we examine users preferences regarding search engine features.
Survey
Design
This
survey was exploratory in nature. The primary goal was to examine user preference
for search engine features, as well as the relationship between search engine
preference and feature preference.
Potential
confounding variables included the participants themselves, accounting for
individual background and experience with computers, the Internet, or search
engines. To understand our respondent sample better,we also measured certain
demographic variables such as age, gender, how long participants had been
using the Internet, and how frequently they used it.
To
enable the comparison of respondents, the survey was primarily implemented
using multiple choice or check box answers, rather than open-ended or fill-in
answers. This also reduced the burden on participants and increased the "codability"
of the results. Initial pilots were performed on paper, while the final iteration
and ultimate deployment were using a web-based method. The survey instrument
was designed in several iterations. Team members drafted the initial survey,
using our own experience and other search-related survey instruments and past
research results as sources. The survey was initially piloted with 3 participants,
on paper with a team member at hand to observe and answer questions. A subsequent
iteration was piloted online, to fine-tune the survey instrument as well as
test the web-based survey for problems. Pilot participants were not participants
in the full deployment, to avoid the possibility of introducing bias in the
results.
Method
Participants
Both the subject matter of the survey (search engine usage) and its method
of deployment (web-based) required us to limit our sample to a population
that: (1) uses the Internet; (2) uses at least one search engine; and (3)
is accessible by email.
This project had access to very few resources, especially regarding the identification
and recruitment of participants. Participants were recruited by team members
from among a population of known individuals (colleagues, friends, family),
introducing the possibility of respondent bias. Thus, the generalizability
of the survey is low.
To avoid selection bias (beyond the preexisting personal relationship), we
attempted to recruit the entire population of personally-known, electronically-accessible
individuals (i.e., friends, colleagues, whose email address was known). The
sample can be characterized as relatively technically savvy, advanced users
of the Internet. Overall, this sample has been online longer, as well as more
frequently for longer periods of time, than the population at large, as we
will see when we examine the demographic data. As a result of the nature and
extent of the sampling method, these results can only be generalized to a
limited population.
Participants were contacted by email, with a link to the web-based survey.
(See the appendix for the recruitment/instructions text.) No compensation
or disclosure agreements were associated with participation in the survey,
and participants were assured of anonymity. Upon deployment, the survey instrument
was posted for 7 days before being closed to participants.
Of
a total of a sample size of approximately 100-200 , 64 participants responded
(32-64% response rate, depending upon size). The web-based survey was "hit"
86 times, and completed successfully 64 times. For the purposes of this analysis,
we assume each participant completed the survey only once.
Results
Demographic Distribution
The demographic distribution of the respondents was very limited. Overall,
respondents were primarily male between the ages of 19 and 36, who use the
Internet an average of 4-5 hours per day and report having been online for
five years or more.
|
Distribution
of Gender among respondents
N=64
|
Age distribution
among respondents 
N=64
Mean=4.25(range 25-36 yrs) Std Dev=.84
|
An overwhelming majority of respondents report using the web for five years
or more. We chose the annual GVU study of Internet Usage as a reasonable measure
of the population for the purposes of comparison of our sample to the broader
population. Per the 10th GVU study,
only 37% of GVU respondents reported being on the Internet between 4 to 6
years, with nearly half the respondents reporting being online for less than
three years. Regarding hours of Internet use, approximately 34% of GVU respondents
reported using the Internet between 1-3 hours per day, and an additional 21%
reported using the Internet between 3-5 hours per day. Only 10% reported using
the Internet more than 5 hours per day. This contrasts sharply with our respondents,
of whom almost 36% report using the Internet more than five hours per day.
Even given the age of the GVU data (now more than 2 years old), and knowing
the source of the sample, this would tend to confirm that the sample is heavily
biased toward highly technical, experienced Internet users.
Length
of time using the web

N=64 Std Dev = .43
|
Hours per
day using the Internet
N=64
Std Dev=1.56
|
Information seeking: usage of the Internet and search engines
The majority of respondents reported using the Internet to find information
every time or most of the time. On this aspect our sample is in keeping with
the GVU study, where 70% of respondents reported using the Internet to search
for information most of the time. The high likelihood that the Internet is
a first resort in information-seeking behavior is further evidence that catering
to users' feature preferences may result in both a more successful search
engine and more successful searches.
|
Use of the
Internet in
information-seeking behavior

N=64StdDev=.71
|
Use
of search engines
in information-seeking behavior
N=64
StdDev=.85
|
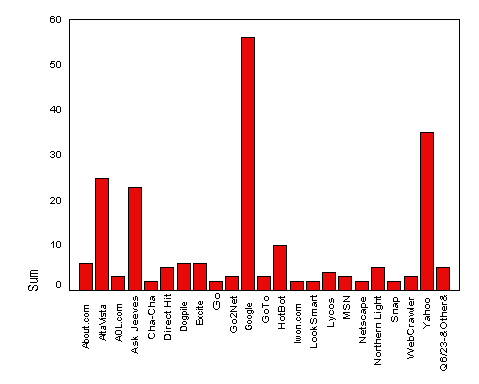
The popularity of a handful of engines became apparent upon analysis
of the data. We asked users to identify which search engines they had used
in the last year. A small number of engines showed a high frequency, corresponding
to our later findings regarding primary search engine.
Which search engines have you used in the last year?

| Search engines used in the last year |
|
Search Engine
|
Count
of Responses
|
%
of Total Responses
|
%
of Total Respondents*
|
|
About.com
|
19
|
5.2
|
29.7
|
|
AltaVista
|
45
|
12.3
|
70.3
|
|
AOL.com
|
3
|
.8
|
4.7
|
|
AskJeeves
|
51
|
14.0
|
79.7
|
|
Cha-Cha
|
3
|
.8
|
4.7
|
|
DirectHit
|
6
|
1.6
|
9.4
|
|
Dogpile
|
8
|
2.2
|
12.5
|
|
Excite
|
21
|
5.8
|
32.8
|
|
Go
|
6
|
1.6
|
9.4
|
|
Go2Net
|
5
|
1.4
|
7.8
|
|
Google
|
58
|
15.9
|
90.6
|
|
GoTo
|
4
|
1.1
|
6.3
|
|
HotBot
|
20
|
5.5
|
31.3
|
|
Iwon.com
|
1
|
.3
|
1.6
|
|
LookSmart
|
3
|
.8
|
4.7
|
|
Lycos
|
18
|
4.9
|
28.1
|
|
MSN
|
8
|
2.2
|
12.5
|
|
Netscape
|
13
|
3.6
|
20.3
|
|
NorthernLight
|
9
|
2.5
|
14.1
|
|
Snap
|
2
|
.5
|
3.1
|
|
WebCrawler
|
7
|
1.9
|
10.9
|
|
Yahoo
|
55
|
15.1
|
85.9
|
|
|
365
|
100.0
|
570.3
|
64 respondents;
0 missing/invalid
*Respondents were permitted to report up to 5 search engines.
Search Engine Preference
One
of our hypotheses was that, of the multitude of search engines available,
a small handful held the greatest "mindshare". This hypothesis was
confirmed by our data. We asked respondents to identify their primary search
engine ("Q8: Please select a primary web search engine, one that you
would say that you primarily use when looking for information:" (multiple
check box options)). Of the 22 search engines listed in the survey, in addition
to an "Other/Fill in" option, a majority of respondents (89%) settled
on one of three engines as their primary engine: AltaVista, Google, and Yahoo!.
Primary
Search Engine

We sought to determine what factors played into the choice of a primary search
engine, including feature preference, habit/convenience, as well as how likely
users were to maintain a preference, once identified. We found similar aggregate
patterns among search engines used in the last year, favorite search engines,
and frequently used search engines. The distribution of most popular search
engines tracked across all these dimensions.
We were unsure about the (potentially confounding) role of habit or convenience
in primary search engine choice. The potential dissonance between frequently
used/primary engine and favorite engine was of particular concern. In piloting
the survey, we discovered a number of pilot participants who responded that
their primary search engine was not their favorite search engine, for a variety
of reasons (such as habit or convenience, or other technical constraints).
We chose to ask about both frequently used and favorite search engines to
determine whether or not a confounding variable, such as habit or convenience,
was acting on the relationship. We discovered there was a high positive correlation
(depending upon search engine, in the range of .701 to 1.0,significant at
the 0.01 level (2-tailed)) between a particular search engine being identified
as frequently used and also as favorite. (Correlational
Matrix) This correlation is also visible in the similar patterns of the
frequency distribution of the two questions.
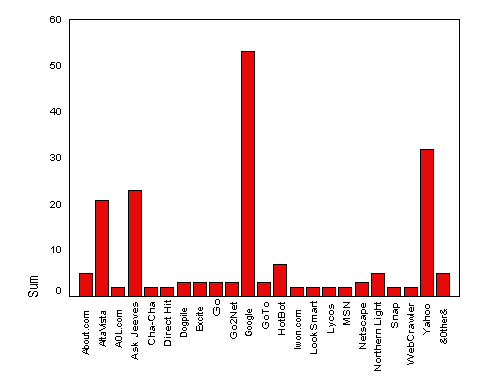
|
Which search engines tend to be favorite?
Q6:
Please select your favorite web search engines (select up to 5):
|
| Favorite
web search engines |
|
Search Engine
|
Count
of Responses
|
%
of Total Responses
|
%
of Total Respondents*
|
|
About.com
|
4
|
2.4
|
6.3
|
|
AltaVista
|
23
|
13.9
|
35.9
|
|
AOL.com
|
1
|
.6
|
1.6
|
|
AskJeeves
|
21
|
12.7
|
32.8
|
|
DirectHit
|
3
|
1.8
|
4.7
|
|
Dogpile
|
4
|
2.4
|
6.3
|
|
Excite
|
4
|
2.4
|
6.3
|
|
Go2Net
|
1
|
.6
|
1.6
|
|
Google
|
54
|
32.5
|
84.4
|
|
GoTo
|
1
|
.6
|
1.6
|
|
HotBot
|
8
|
4.8
|
12.5
|
|
Lycos
|
2
|
1.2
|
3.1
|
|
MSN
|
1
|
.6
|
1.6
|
|
NorthernLight
|
3
|
1.8
|
4.7
|
|
WebCrawler
|
1
|
.6
|
1.6
|
|
Yahoo
|
35
|
21.1
|
54.7
|
|
Total responses
|
166
|
100.0
|
259.4
|
64 respondents;
0 missing
*Respondents were permitted to report up to 5
search engines.
|
|
Which search
engines are used most frequently?
Q7:
Please select the web search engines that you use most frequently (select
up to 5):
|
| Search
engines used most frequently |
|
Search Engine
|
Count
of Responses
|
%
of Total Responses
|
%
of Total Respondents*
|
|
About.com
|
3
|
2.1
|
4.8
|
|
AltaVista
|
19
|
13.6
|
30.2
|
|
AskJeeves
|
21
|
15.0
|
33.3
|
|
Dogpile
|
1
|
.7
|
1.6
|
|
Excite
|
1
|
.7
|
1.6
|
|
Go
|
1
|
.7
|
1.6
|
|
Go2Net
|
1
|
.7
|
1.6
|
|
Google
|
51
|
36.4
|
81.0
|
|
GoTo
|
1
|
.7
|
1.6
|
|
HotBot
|
5
|
3.6
|
7.9
|
|
Netscape
|
1
|
.7
|
1.6
|
|
NorthernLight
|
3
|
2.1
|
4.8
|
|
Yahoo
|
32
|
22.9
|
50.8
|
|
Total responses
|
140
|
100.0
|
222.2
|
63 respondents;
1missing
*Respondents were permitted to report up to 5 search
engines.
|
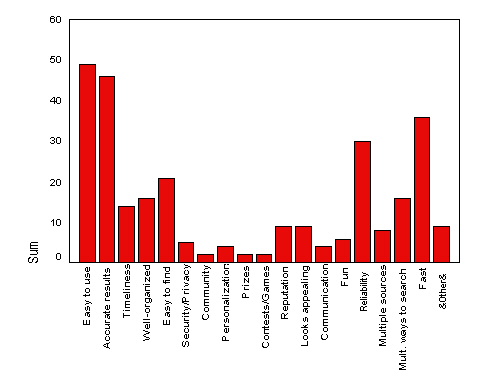
Feature
Importance
We
were interested in exploring which features attracted users to their primary
search engine. We discovered that the following features play the most significant
role in primary engine choice: ease of use and to find, accuracy, reliability,
and speed. None of these are surprising, but it is interesting that "easy
to find" ranks relatively high compared to other features.
Features and Primary Engine Choice
Q12: What features
make you use your primary search engine more frequently than others (select
up to five):
| Features and Primary Engine
Choice |
|
Search Engine Feature
|
Count
of Responses
|
%
of Total Responses
|
%
of Total Respondents*
|
|
Site is easy to use
|
47
|
19.0
|
77.0
|
|
Site has accurate search results
|
44
|
17.8
|
72.1
|
|
Site has timely, up-to-date
content and news
|
4.9
|
19.7
|
|
|
Site is well-organized
|
14
|
5.7
|
23.0
|
|
Site is easy to get to
|
21
|
8.5
|
34.4
|
|
Security and privacy
|
3
|
1.2
|
4.9
|
|
I can personalize the site,
tailoring it to my interests and needs
|
.8
|
3.3
|
|
|
Site has a good reputation
|
9
|
3.6
|
14.8
|
|
Site looks appealing
|
7
|
2.8
|
11.5
|
|
Site allows me to communicate
with other people (email, messaging, chat, postcards
|
.8
|
3.3
|
|
|
Site is fun
|
4
|
1.6
|
6.6
|
|
Site is reliable
|
28
|
11.3
|
45.9
|
|
Site allows me to search various
sources (multiple search engines, newsgroups, etc.)
|
6
|
2.4
|
9.8
|
|
Site allows me to look for inform
in various ways (Boolean, keywords, questions)
|
5.7
|
23.0
|
|
|
Site is fast
|
34
|
13.8
|
55.7
|
|
Total responses
|
247
|
100.0
|
404.9
|
61 respondents; 3 missing/invalid
*Up to five
features selected per respondent
Prompted by our findings regarding the primary engine attribute "easy
to find", the question of how users get to their primary search engine
became intriguing. We hypothesized that users might rely on bookmarks or default
home pages to access their primary search engine. However, it was interesting
to discover that users tended to access their primary search engine by typing
in the URL, over these other methods. This has implications for the "naming"
(URL identification) of search engines. In other words: the more memorable,
shorter, and easier to type, the better.
How users get to their primary search engine
N=64 StdDev=1.53
We were also interested in the "stickyness" of a search engine:
once a user has chosen a primary search engine, how likely is he or she to
continue to use it? We discovered that a significant proportion of respondents
(X%) reported using their primary engine for two years or more. We also discovered
a small positive correlation between the choice of primary search engine,
and when users reported first using their primary engine (0.203, Pearson correlation).
This may be expected, given (1) the "stickiness" factor, and (2)
that search engines launch (and launch advertising campaigns) at different
times.
"Stickyness" of a primary search engine
N=64 Mean=3.72,
StdDev=1.15
It is interesting to note gradient differences among "first use"
between the three top primary engine subgroups: users of Yahoo!, Google, and
AltaVista. It appears that users who reported Alta Vista as their primary
engine first used the engine more than two years ago, indicating a certain
"stickyness", while primary users of Yahoo! reported first using
the engine between 1-3 years ago. Meanwhile, users who reported Google as
their primary search engine are shifted significantly along timeframe to more
recently in time, reporting first use between 0-1 years. This shift in adoption
is not necessarily due to Google's relative inception date (Google was founded
in 1998), but may rather be a result of a marketing campaign or other 'buzz'
later in the timeline.
Stickyness by Primary Engine Subgroups

Again, in an attempt to ascertain how users perceive their primary search
engines versus other engines, and to further explore the possibility of confounding
variables, we asked users to compare their primary engine to others they’ve
used. The majority rated their primary search engine as much better than other
search engines. Overall, users rated their primary search engine as somewhat
better than other search engines they've used, which corresponds to the "stickyness"
of a primary search engine, once chosen.
Comparison of primary search engine to other engines used

N=64,
StdDev=.64
We also explored primary search engine choice along to the other demographic
dimensions, including experience on the web, gender, and age, but discovered
no significant correlation.