Project Proposal
Project Goals
Our visualization's goal is to create the “ideal” layout of a photo collection, arranging the photo thubmails in such a way as to match people's underlying cognitive process of identifying groups of related photos. (Or as close to ideal as we can get). The data behind this layout will be a dynamically calculated value of “closeness” between any two photos, based on similarities in the photos' metadata. The relative attractive weighting of the various types of metadata will be adjustable through the user interface, allowing a live exploration of the photo collection's visualization.
Our hope is that the interface will be intuitive enough as to allow people to adjust the weights to maximize the similarity between the on-screen grouping of photographs and how an individual would classify or tag their photo collection. This technique may be applicable to the larger problem of photo tagging and annotation. The act of using the grouping to easily tag photos, and dynamically recalculating the weighting based on the grouping, is out of scope of this project but may be a future direction for the team.
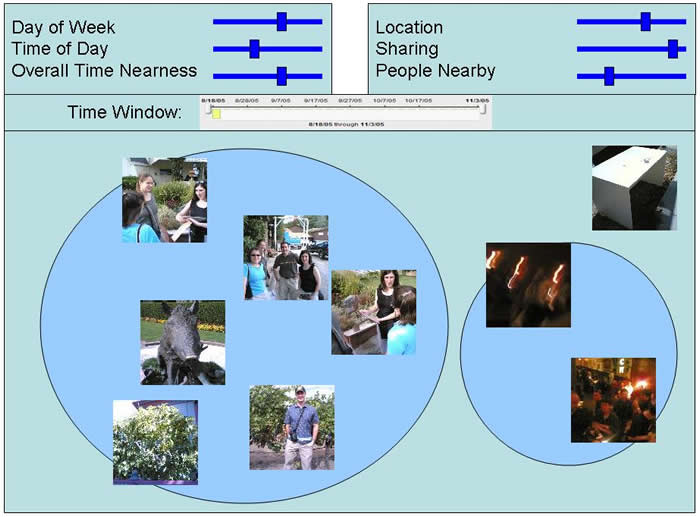
In the following sketch, the blue slider bars along hte top represent various types of available metadata. Sliding the sliders to the right increases the relative “attraction” between two photos that have similar values for the selected metadata type. The large blue ovals represent clusters of photos, something that we would like to make part of the visualization, but will likely be out of scope.
Discussion of Related Work
- Tag Clouds: Flickr and other similar systems use “tags” to represent semantic-free metadata associated with a single image. Similar tags form clusters of images with identical tags, and recently, has begun to evolve into more complex tagging clusters
- MMM2 Research: Metadata Pattern recognition has been used to predict sharing, as well as attempt to predict what additional metadata tags are likely to be applied to a given image. Our technique is the inverse: to use the metadata to predict what additional images are likely to be part of a cluster
- Tag-based personal photo managers: Products like picassa are beginning to use tagging instead of folders to arrange personal photo collections.
- Multidimensional Detective – Alfred Inselberg
- Degree of Interest – Stuart Card
Which data (if any) will be used to accomplish the goals
- MMM2 Data Archive
- (Possibility restricted to data gathered by Dave, Ben, and Carrie to ensure access to the data)
- We also may arrange on a per-user basis to isolate if our technique furthers the relevance and organization argument
- Flickr Tages (based on which tags appear with others)
- de.li.ci.ous
- Yahoo's myweb2.0
Which tools will be used to accomplish the goals (this can change if needed)
- Java based Prefuse toolkit
- Pens, Paper, Markers...drawing tools
What steps will be required to accomplish your goals
- Define visualization goals - What do we want to be able to accomplish that can't be done with other tools?
- Test the concept with potential users - Paper sketch prototype
- Revise concept - How did users see it as working?
- Plan coding architecture - What additions to prefuse will be necessary, how to integrate with mmm2 data
- Develop a working mock-up - Potentially "fake" some nearness values for testing
- Revise, add functionality to the mock-up
What kinds of results you anticipate achieving
- An ideal solution would mirror a users "cognitive" sense of photo arrangement - photos would be groups in the same cluster reflecting "nearness" to each other, facilitiating recognition and recall of significant events
- We would like to know if the visualization can be dynamically updated as a user continues to manipulate the values of provided metadta, making the process iterative and interesting
- Would would also like to know, given the flexible and adjustible weights of various types of metadata, what settings seem to cluster the photos in the most useful ways? Are there some balances of weightings that would make a good starting point for this type of visualaization?