INFO 290. Sensors, Humans, Data, and AppsUC BerkeleySchool of Information Fall 2014 |
|
| Home - Projects - Logistics - Schedule - Lending Library - Class Wiki |
Synchronized Brainwave Recordings from a Group Presented with a Common Visual Stimulus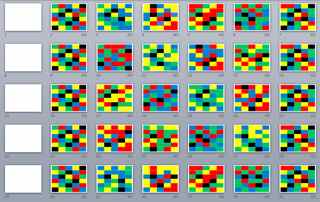
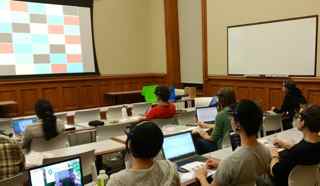 In conjunction with the 20th Annual Brain Awareness Week (March 16-22 2015), the participants of the Fall 2014 INFO290 class are sharing with the research community a first-of-its-kind dataset collected using consumer-grade brainwave-sensing headsets during an in-class group exercise, along with the software code and visual stimlus used to collect the data. The group exercise is a "Color Counting Challenge" where the 25 students in the class are presented with a visual stimulus (duration 162 seconds) consisting of a timed sequence of images with colored rectangles arranged in a 5x6 matrix. The rectangles are colored in red, green, blue, yellow, and black, with varying numbers of rectangles of each color on each image. At the start of the exercise, each participant is first asked to select a color from {red, green, blue, yellow}. Then, each participant is instructed to silently count the number of rectangles of their chosen color as each image is displayed on the projector screen. Brainwave signals are collected from each participant using Neurosky Mindwave Mobile devices. The data is transmitted over a Bluetooth connection to a software client installed on each participant's notebook computer, and then forwarded to a networked server for storage. Data ConfidentialityWe take four steps to protect the confidentiality of the participants. First, the data is collected anonymously. Each of the participants randomly selects a paper slip with a number which they enter into the client software as their ID. No person has any knowledge of which ID was chosen by which student. Second, the ID is re-mapped so that the students do not know which participant_id in the final dataset corresponds to their own data. Third, the dataset contains data from 12 participants, which is less than 50% of the entire population of 25 students. Therefore, for any given student, there is a less than 50% probability that their data is part of the dataset. Finally, we do not hold data from the remainder of the population, and there is no way for us to reconstruct a dataset for all 25 participants.Data FormatThe server receives one data packet every two seconds from each Mindwave Mobile device, and stores the data in one row entry with the following 8 data fields:participant_id, start_time, end_time, raw_values, attention_esense, meditation_esense, eeg_power, signal_quality participant_id: Integer value in the range of 1 to 12. start_time and end_time: The visual stimulus lasts a total of 162 seconds. The stimulus is started at t=2:20 (2 minutes 20 seconds), and ends at t=5:02 (5 minutes 2 second). The remaining five fields are defined by the Neurosky SDK: raw_values: Tuple containing raw sample values acquired by the sensor, at a sampling rate of 512Hz. attention_esense and meditation_esense: Neurosky's eSense meters for Attention and Meditation levels, in integer values in the range of 0 to 100. The values represent the last values computed in the current period. eeg_power: Tuple represents the magnitude of 8 commonly-recognized types of EEG frequency bands -- delta (0.5 - 2.75Hz), theta (3.5 - 6.75Hz), low-alpha (7.5 - 9.25Hz), high-alpha (10 - 11.75Hz), low-beta (13 - 16.75Hz), high-beta (18 - 29.75Hz), low-gamma (31 - 39.75Hz), and mid-gamma (41 - 49.75Hz). These values have no units and are only meaningful for comparison to the values for the other frequency bands within a sample. signal_quality: A zero value indicates good signal quality. A value of 128 greater corresponds to a situation where the headset is not being worn. In total, the dataset consists of 972 rows of data, corresponding to 81 rows of data (for 162 seconds stimulus duration) from 12 participants. MetadataFor each participant, we also anonymously collected three pieces of metadata: gender, handedness, and chosen color.Downloads
CitationPlease use the following citation if you publish your research results using this dataset or software code or stimulus file:John Chuang, Nicolas Merrill, Thomas Maillart, and Students of the UC Berkeley Fall 2014 INFO290 Class. "Synchronized Brainwave Recordings from a Group Presented with a Common Visual Stimulus." March 2015. |