
Infoviz Final Project Demonstrations
Final Project Reports and Demonstrations 2014


Fire and Drought in California
Xavier Malina, Cameron Reed, Peter Swigert
report


Chinese
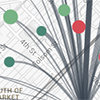
Government Online Censorship
Wendy Xue, Shaohan Chen, Deb Linton
report

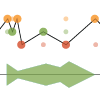
TaleSpin:
Visualizing Airline
Accidents Over Time
Hassan Jannah, Siddharth Agrawal, Sufia Siddiqui
report

Produce
Availability in the U.S.
Katey Basye and Anna Swigart
report
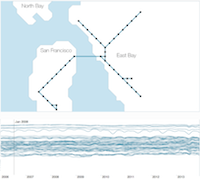
BART Ridership Visualization
Kayu Chen, Shubham Goel, Robyn Perry
report
Common Ground
Jenton Lee and Isha Dandavate
report

Crimes Against
Women in India
Ankita Bhosle,
Janine Heiser, Ruchita Rathi
report

How High? The
Cost of Rec. Drugs
Chalenge Masekera, Marjan Ghahremani, Pablo Arvizu
report
Domain Censorship in China
Sophia Lay, Faye Ip
report
About i247
The goal of information visualization is the unveiling of the underlying structure of large or abstract data sets using visual representations that utilize the powerful processing capabilities of the human visual perceptual system.
In this course, students learn how to COMMUNICATE information visually, EXPLORE and ANALYZE data visually, and ASSESS visual representations in a principled manner. They also develop an understanding of PRINCIPLES (cognitive and design) underlying visualization, and STANDARD representations and when to use them. Finally, students get exposure to history, research, and debates in the field.
Other recent years: Spring 2016 and Spring 2015
Tools and Techniques
Learning in this course is accomplished via Practice, Principles, Peer Learning, and Programming.
Software tools learned in Spring 2014 were Highcharts (for creating well-motivated, aesthetically pleasing standard charts), Illustrator (for designing Infographics), Tableau (for Exploratory Data Analysis), and d3 (for creating novel, interactive visualizations).
Books used: Few, Stephen: Now You See It, Analytics Press, 2009, and Cairo, Alberto: The Functional Art, New Riders, 2013.