ADDITION TO PEOPLE PETALS / ANDREA DESIGN IDEAS:
Clarification to 2 design ideas:
These ideas include the information visualization overview pane where all graphical information is displayed. They also elaborate on how the overview / visualization will work, as the following windows have been added: a detail pane and additional scope/zoom panes, and a color legend.
OVERVIEW: where visualization occurs
SCOPE / VIEW PANES: where parameters may be specified. This is reflected in the overview pane as scope is narrowed or expanded. Parameters include time, place, copresents (people), and perhaps also subject, event, and most viewed, allowing for evolution of the interface as the photo is used, annotated, or viewed.
COLOR LEGEND: deciphers the color code for people petals. A new consideration is that color is customizable so that familiar friends have a memorized color associated with them. Also, if one does not want to see all the Bluetooth copresents, in this window, you could check a button to select “save these people to my friends”—and then in the “people” scope parameter, you could specify to only view people from the “my friends” database instead of all copresents.
The two ideas below are identical in UI design. What is different is how the visualization occurs.
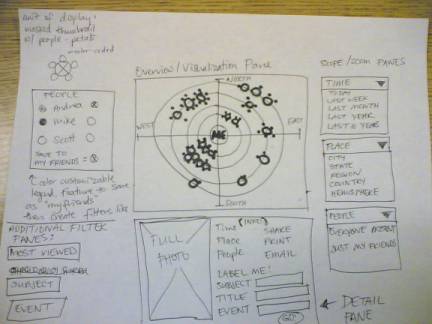
I like this idea the best. Drawing on the idea of an x-y, 4-quadrant graph that maps compass points for space, and also the idea of an old circular Christian calendar mapping that uses concentric circles, photos are plotted as thumbnail images with surrounding people petals. At the center is the owner of the photos, right now, right where they are (perhaps the “home base” of the phone). Time that is closest to here and now is the innermost concentric circle. Photos from this time are then graphed to relative location on the map, being further north, or further south east, etc, etc. Once again, note that using scope/zoom panels we can adjust the time and place limits that are seen.
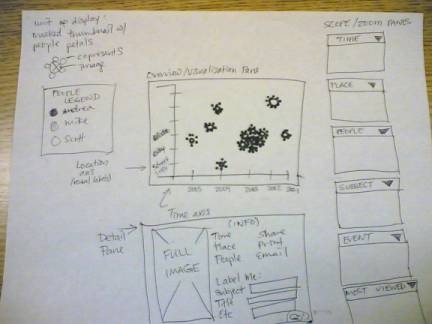
More traditional scatterplot design again using people petals. Y axis is place, noted by label, and time is the x axis. Again, using the scope/zoom panels, one can adjust whether you’re viewing the whole collection or a specific parameter that is narrowed down.