MaNIS Inital Design #2
Rebecca and Jane's Design
Contents
Interaction Flow
On the first screen, the user enters initial search criteria and specifies any changes to the defaults for which data providers' collections will be searched. The results of this initial search will be presented in a summary format where simple clicks allow the search to be refined to more specific search results, using a query browsing style similar to that developed by the Flamenco project. This search refinement step can also be conducted on a map interface, similar to that employed by the current Museum of Vertebrate Zoology's specimen database. Finally, the set of records specified by the refined search can be viewed as a table, with tools to adjust the sort order, columns shown and their order, to navigate between pages of the list, and to download the results.
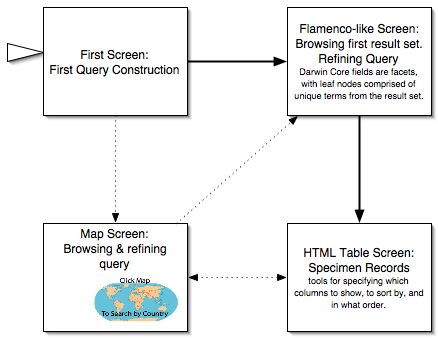
The thick arrows designate the primary interaction flow, while the dotted arrows indicate additional possible flows. The user is free to navigate between the map view, list view, and Flamenco view to repeatedly refine the search and view results as a map, table of records, or in summary statistics, respectively. In order to avoid disorienting the user, the different screens will maintain a similar context.
Details - The First Screen
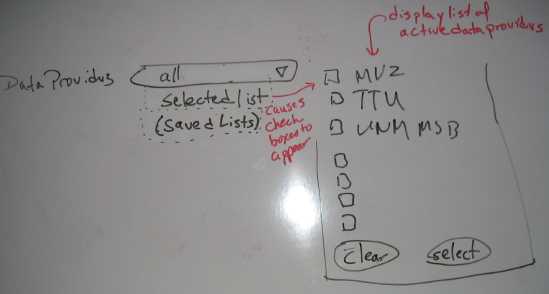
On the first screen, the user enters initial search criteria and specifies any changes to the defaults for which data providers' collections will be searched.
The default is for the search to include all data providers. A short pull down menu includes the option to "select" the data providers, which causes the page to reload with the list of all providers and checkboxes next to their names.
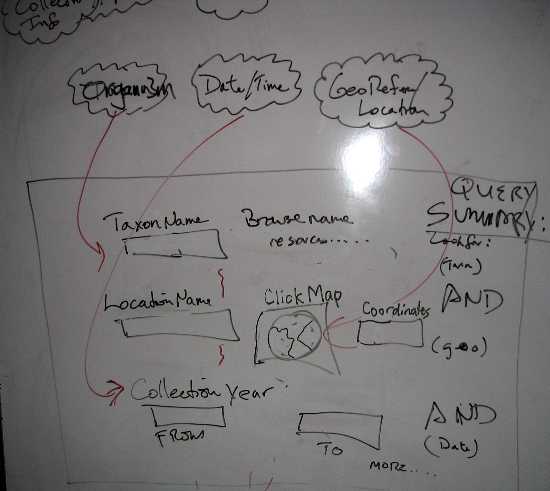
Although each museum's collection database may maintain a variety of unique fields, they will also share the minimum set of fields defined by the Darwin Core. These fields fall into groups that provide information about the specimen's scientific name, the preparation and curation of the specimen, various dates and times associated with the specimen including collection year, and the various types of geographic information associated with the specimen. We've identified these information groups as major components of a search effort, and dubbed them "organism", "collection details", "date/time", and "geography." These groups provide the facets that are most likely to be combined to create conditions that define a user's search.
To start, the user activates one or more components to be used in the search. After activation, the component will display the most-likely field and prompt the user to enter a value. For example, when the "Date/time" component is activated, the most-likely fields are arranged into a "Collected between xxxx and xxxx" condition, where xxxx are text boxes for the user to enter a year. Pull-down menus allow users to customize the default condition. By default, the conditions are "AND"ed together, but the user may change this, too. These conditions create the initial search results.
Details - The "Flamenco" screen
Once the initial search results have been retrieved, the user is presented with summary statistics about which museums have how many of which specimens meeting the search criteria. Each component of the search, activated or not, becomes one of the facets on the Flamenco screen. All unique terms present in that facet within the search results appear listed, with a number that indicates the size of the found record set if the user chooses to limit the search results by that term. In this way, the user can adjust the conditions of the query, making it broader or more specific, to find the optimal result set for their purposes.
Details - the Map screen
At any point in the process, the user can request to interact with the found set using the map interface. The collection localities of the found set of specimens are shown on an interactive map with political boundaries. By selecting an area of the map, the user can define geographic conditions for the search query. The selected set can be saved as a color map or as datafile of points with associated specimen information fields.
Details - the Table View screen
At any point in the process, the user can request to interact with the found set as list of records. Large found sets will be displayed as multiple pages, and appropriate navigation links are provided. Clicking the top of any column will sort the found set by the values in that column. The user can specify which fields will be displayed by checking or unchecking the name of a column. Three pre-defined field sets are provided, including the full specimen record, a taxonomic set, and a geographic set. The found set can be downloaded in a variety of convenient formats, including CSV, .xl, and points datafile. The download can include the entire found set, or multiple files divided up by unique values in any particular field. This allows downloading a different file for each museum, for example, as the full specimen record from any museum will include its own fields in addition to the Darwin Core information.