| Output Created | 23-FEB-2004 14:38:31 | |
|---|---|---|
| Comments | ||
| Input | Data | W:\courses\is208A\s04\web_data.sav |
| Filter | <none> | |
| Weight | <none> | |
| Split File | <none> | |
| N of Rows in Working Data File | 50 | |
| Missing Value Handling | Definition of Missing | User-defined missing values are treated as missing. |
| Cases Used | Statistics are based on all cases with valid data. | |
| Syntax | FREQUENCIES VARIABLES=length /STATISTICS=STDDEV RANGE MINIMUM MAXIMUM MEAN MEDIAN MODE /ORDER= ANALYSIS . |
|
| Resources | Total Values Allowed | 18724 |
| Elapsed Time | 0:00:00.11 | |
| N | Valid | 50 |
|---|---|---|
| Missing | 0 | |
| Mean | 43.56 | |
| Median | 35.00 | |
| Mode | 87 | |
| Std. Deviation | 29.91 | |
| Range | 96 | |
| Minimum | 3 | |
| Maximum | 99 | |
| Output Created | 23-FEB-2004 14:40:06 | |
|---|---|---|
| Comments | ||
| Input | Data | W:\courses\is208A\s04\web_data.sav |
| Filter | <none> | |
| Weight | <none> | |
| Split File | <none> | |
| N of Rows in Working Data File | 50 | |
| Missing Value Handling | Definition of Missing | User-defined missing values are treated as missing. |
| Cases Used | Statistics are based on all cases with valid data. | |
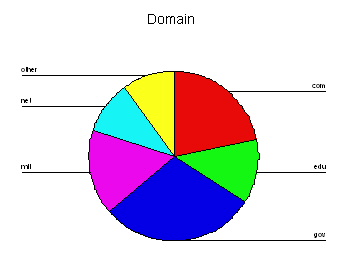
| Syntax | FREQUENCIES VARIABLES=domain /PIECHART PERCENT /ORDER= ANALYSIS . |
|
| Resources | Total Values Allowed | 18724 |
| Elapsed Time | 0:00:00.09 | |
| Frequency | Percent | Valid Percent | Cumulative Percent | ||
|---|---|---|---|---|---|
| Valid | com | 11 | 22.0 | 22.0 | 22.0 |
| edu | 6 | 12.0 | 12.0 | 34.0 | |
| gov | 15 | 30.0 | 30.0 | 64.0 | |
| mil | 8 | 16.0 | 16.0 | 80.0 | |
| net | 5 | 10.0 | 10.0 | 90.0 | |
| other | 5 | 10.0 | 10.0 | 100.0 | |
| Total | 50 | 100.0 | 100.0 | ||
| Output Created | 23-FEB-2004 14:44:29 | |
|---|---|---|
| Comments | ||
| Input | Data | W:\courses\is208A\s04\web_data.sav |
| Filter | <none> | |
| Weight | <none> | |
| Split File | <none> | |
| N of Rows in Working Data File | 50 | |
| Missing Value Handling | Definition of Missing | User-defined missing values are treated as missing. |
| Cases Used | Statistics are based on all cases with valid data. | |
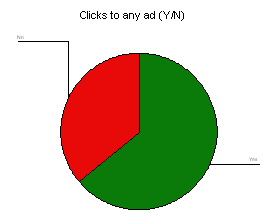
| Syntax | FREQUENCIES VARIABLES=any_ad /PIECHART PERCENT /ORDER= ANALYSIS . |
|
| Resources | Total Values Allowed | 18724 |
| Elapsed Time | 0:00:00.13 | |
| Frequency | Percent | Valid Percent | Cumulative Percent | ||
|---|---|---|---|---|---|
| Valid | Yes | 32 | 64.0 | 64.0 | 64.0 |
| No | 18 | 36.0 | 36.0 | 100.0 | |
| Total | 50 | 100.0 | 100.0 | ||
| Output Created | 23-FEB-2004 14:50:53 | |
|---|---|---|
| Comments | ||
| Input | Data | W:\courses\is208A\s04\web_data.sav |
| Filter | <none> | |
| Weight | <none> | |
| Split File | <none> | |
| N of Rows in Working Data File | 50 | |
| Missing Value Handling | Definition of Missing | User-defined missing values are treated as missing. |
| Cases Used | Statistics are based on all cases with valid data. | |
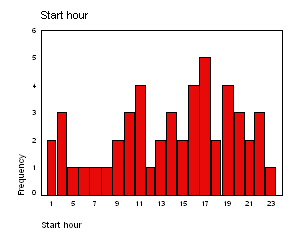
| Syntax | FREQUENCIES VARIABLES=start_hr /BARCHART FREQ /ORDER= ANALYSIS . |
|
| Resources | Total Values Allowed | 18724 |
| Elapsed Time | 0:00:00.06 | |
| Frequency | Percent | Valid Percent | Cumulative Percent | ||
|---|---|---|---|---|---|
| Valid | 1 | 2 | 4.0 | 4.0 | 4.0 |
| 2 | 3 | 6.0 | 6.0 | 10.0 | |
| 5 | 1 | 2.0 | 2.0 | 12.0 | |
| 6 | 1 | 2.0 | 2.0 | 14.0 | |
| 7 | 1 | 2.0 | 2.0 | 16.0 | |
| 8 | 1 | 2.0 | 2.0 | 18.0 | |
| 9 | 2 | 4.0 | 4.0 | 22.0 | |
| 10 | 3 | 6.0 | 6.0 | 28.0 | |
| 11 | 4 | 8.0 | 8.0 | 36.0 | |
| 12 | 1 | 2.0 | 2.0 | 38.0 | |
| 13 | 2 | 4.0 | 4.0 | 42.0 | |
| 14 | 3 | 6.0 | 6.0 | 48.0 | |
| 15 | 2 | 4.0 | 4.0 | 52.0 | |
| 16 | 4 | 8.0 | 8.0 | 60.0 | |
| 17 | 5 | 10.0 | 10.0 | 70.0 | |
| 18 | 2 | 4.0 | 4.0 | 74.0 | |
| 19 | 4 | 8.0 | 8.0 | 82.0 | |
| 20 | 3 | 6.0 | 6.0 | 88.0 | |
| 21 | 2 | 4.0 | 4.0 | 92.0 | |
| 22 | 3 | 6.0 | 6.0 | 98.0 | |
| 23 | 1 | 2.0 | 2.0 | 100.0 | |
| Total | 50 | 100.0 | 100.0 | ||
| Output Created | 23-FEB-2004 14:58:18 | |
|---|---|---|
| Comments | ||
| Input | Data | W:\courses\is208A\s04\web_data.sav |
| Filter | <none> | |
| Weight | <none> | |
| Split File | <none> | |
| N of Rows in Working Data File | 50 | |
| Missing Value Handling | Definition of Missing | User-defined missing values are treated as missing. |
| Cases Used | Statistics are based on all cases with valid data. | |
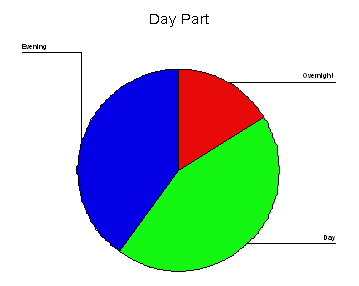
| Syntax | FREQUENCIES VARIABLES=day_part /PIECHART PERCENT /ORDER= ANALYSIS . |
|
| Resources | Total Values Allowed | 18724 |
| Elapsed Time | 0:00:00.16 | |
| Frequency | Percent | Valid Percent | Cumulative Percent | ||
|---|---|---|---|---|---|
| Valid | Overnight | 8 | 16.0 | 16.0 | 16.0 |
| Day | 22 | 44.0 | 44.0 | 60.0 | |
| Evening | 20 | 40.0 | 40.0 | 100.0 | |
| Total | 50 | 100.0 | 100.0 | ||
| Output Created | 23-FEB-2004 15:02:09 | |
|---|---|---|
| Comments | ||
| Input | Data | W:\courses\is208A\s04\web_data.sav |
| Filter | <none> | |
| Weight | <none> | |
| Split File | <none> | |
| N of Rows in Working Data File | 50 | |
| Missing Value Handling | Definition of Missing | User-defined missing values are treated as missing. |
| Cases Used | Statistics for each table are based on all the cases with valid data in the specified range(s) for all variables in each table. | |
| Syntax | CROSSTABS /TABLES=domain BY cookie /FORMAT= AVALUE TABLES /CELLS= COUNT ROW . |
|
| Resources | Dimensions Requested | 2 |
| Cells Available | 14563 | |
| Elapsed Time | 0:00:00.13 | |
| Cases | ||||||
|---|---|---|---|---|---|---|
| Valid | Missing | Total | ||||
| N | Percent | N | Percent | N | Percent | |
| Domain * Accepted cookie (Y/N) | 50 | 100.0% | 0 | .0% | 50 | 100.0% |
| Accepted cookie (Y/N) | Total | ||||
|---|---|---|---|---|---|
| no | yes | ||||
| Domain | com | Count | 8 | 3 | 11 |
| % within Domain | 72.7% | 27.3% | 100.0% | ||
| edu | Count | 4 | 2 | 6 | |
| % within Domain | 66.7% | 33.3% | 100.0% | ||
| gov | Count | 9 | 6 | 15 | |
| % within Domain | 60.0% | 40.0% | 100.0% | ||
| mil | Count | 4 | 4 | 8 | |
| % within Domain | 50.0% | 50.0% | 100.0% | ||
| net | Count | 1 | 4 | 5 | |
| % within Domain | 20.0% | 80.0% | 100.0% | ||
| other | Count | 3 | 2 | 5 | |
| % within Domain | 60.0% | 40.0% | 100.0% | ||
| Total | Count | 29 | 21 | 50 | |
| % within Domain | 58.0% | 42.0% | 100.0% | ||
| Output Created | 23-FEB-2004 15:07:12 | |
|---|---|---|
| Comments | ||
| Input | Data | W:\courses\is208A\s04\web_data.sav |
| Filter | <none> | |
| Weight | <none> | |
| Split File | <none> | |
| N of Rows in Working Data File | 50 | |
| Missing Value Handling | Definition of Missing | User-defined missing values are treated as missing. |
| Cases Used | Statistics for each table are based on all the cases with valid data in the specified range(s) for all variables in each table. | |
| Syntax | CROSSTABS /TABLES=domain BY any_ad /FORMAT= AVALUE TABLES /CELLS= COUNT ROW . |
|
| Resources | Dimensions Requested | 2 |
| Cells Available | 14563 | |
| Elapsed Time | 0:00:00.18 | |
| Cases | ||||||
|---|---|---|---|---|---|---|
| Valid | Missing | Total | ||||
| N | Percent | N | Percent | N | Percent | |
| Domain * Clicks to any ad (Y/N) | 50 | 100.0% | 0 | .0% | 50 | 100.0% |
| Clicks to any ad (Y/N) | Total | ||||
|---|---|---|---|---|---|
| Yes | No | ||||
| Domain | com | Count | 11 | 11 | |
| % within Domain | 100.0% | 100.0% | |||
| edu | Count | 3 | 3 | 6 | |
| % within Domain | 50.0% | 50.0% | 100.0% | ||
| gov | Count | 9 | 6 | 15 | |
| % within Domain | 60.0% | 40.0% | 100.0% | ||
| mil | Count | 3 | 5 | 8 | |
| % within Domain | 37.5% | 62.5% | 100.0% | ||
| net | Count | 4 | 1 | 5 | |
| % within Domain | 80.0% | 20.0% | 100.0% | ||
| other | Count | 2 | 3 | 5 | |
| % within Domain | 40.0% | 60.0% | 100.0% | ||
| Total | Count | 32 | 18 | 50 | |
| % within Domain | 64.0% | 36.0% | 100.0% | ||
| Output Created | 23-FEB-2004 15:16:00 | |
|---|---|---|
| Comments | ||
| Input | Data | W:\courses\is208A\s04\web_data.sav |
| Filter | <none> | |
| Weight | <none> | |
| Split File | <none> | |
| N of Rows in Working Data File | 50 | |
| Missing Value Handling | Definition of Missing | User-defined missing values are treated as missing. |
| Cases Used | Statistics are based on all cases with valid data. | |
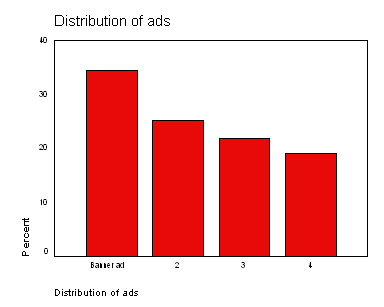
| Syntax | FREQUENCIES VARIABLES=ad_distr /BARCHART PERCENT /ORDER= ANALYSIS . |
|
| Resources | Total Values Allowed | 18724 |
| Elapsed Time | 0:00:00.31 | |
| N | Valid | 32 |
|---|---|---|
| Missing | 18 |
| Frequency | Percent | Valid Percent | Cumulative Percent | ||
|---|---|---|---|---|---|
| Valid | Banner ad | 11 | 22.0 | 34.4 | 34.4 |
| 2 | 8 | 16.0 | 25.0 | 59.4 | |
| 3 | 7 | 14.0 | 21.9 | 81.3 | |
| 4 | 6 | 12.0 | 18.8 | 100.0 | |
| Total | 32 | 64.0 | 100.0 | ||
| Missing | 5 | 18 | 36.0 | ||
| Total | 50 | 100.0 | |||