SIMS 247: Information Visualization
Group Project: Bibliographic Information Visualization and Analysis (BIVA)
Team: Chitra Madhwacharyula, Colleen Whitney, and Lulu Guo
Description of project goals
 The BIVA project developed comparative visualizations to facilitate exploration of items in a bibliographic system using brushing and linking techniques. Although it is possible to explore the data in other ways, the goals was to develop effective (and interactive) visualizations that would help systems designers spot consistent patterns and differences quickly, allowing for more productive decision-making and iteration. In addition, the circulation, holdings and bibliographic record datasets that we used are typically not integrated, and the ability to explore them in tandem is unique. Most of the functionality in the interface containing the visualization was, therefore, targeted towards open exploration and analysis.
The audience is California Digital Library staff. They are responsible for developing tools and programs to serve all UC campuses, including a UC-wide union catalog that contains more than 35 million bibliographic records. CDL staff are not involved with day-to-day workings of the libraries, but many are ex-librarians or have training in the library field. CDL staff needs to be able to find patterns in large sets of bibliographic data in order to develop better services and tools. For example, one related project aims to improve the quality of information retrieval in the UC-wide catalog.
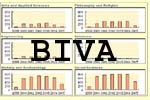
In this project, we focused on three key concepts of interest in exploring the data:
- Circulation patterns by general subject area
- Circulation patterns by time
- The relationship of circulation to holdings
We planned to develop the visualization in three phases, the first two phases of which were completed in the course of this class. First, we randomly selected a small set of sample bibliographic data from the UCLA dataset along with related circulation information. We built our online prototype based on this dataset using a PHP-based graphing library and DHTML. In the second phase, we incorporated feedback from the class design review, modified our design and tested it with a much larger dataset. Using the revised prototype, we conducted informal user studies with three participants from the target user group at CDL. In the third and final phase, beyond the scope of this class, we would improve our visualization based on the feedback from the user study.